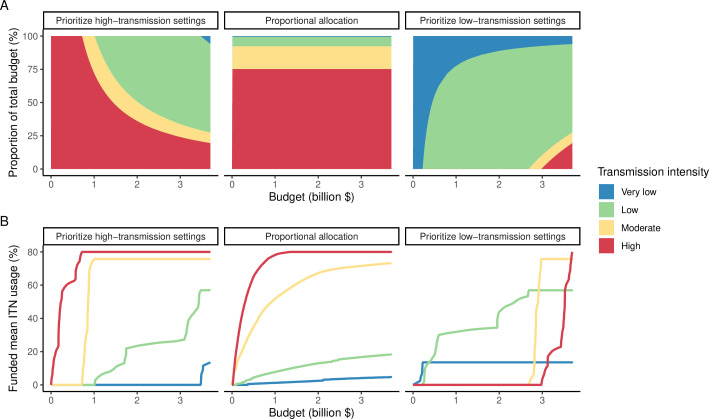
Appendix 1—figure 8. Illustration of resource allocation patterns under the three modeled policy strategies at varying budgets.
(A) Percentage of global funding allocated to each transmission setting. (B) Mean funded insecticide-treated net (ITN) usage in each transmission setting. Transmission intensity groups represent transmission settings with varying population sizes proportional to the global distribution.

