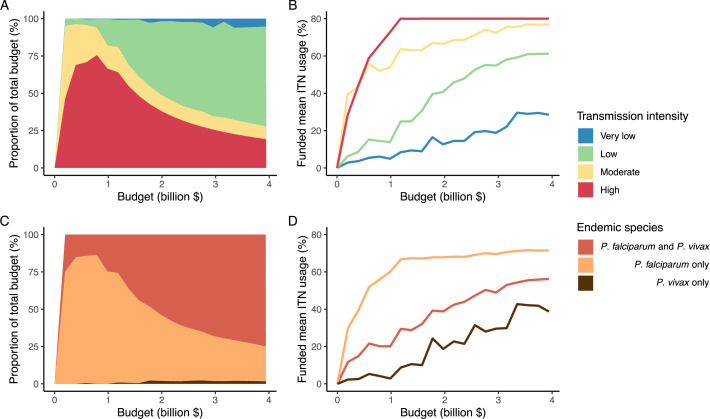
Figure 4. Optimal strategy for funding allocation across settings to minimize malaria case burden at varying budgets.
Panels show optimized allocation patterns across settings of different transmission intensities (panels A and B) and different endemic parasite species (panels C and D). The proportion of the total budget allocated to each setting (panels A and C) and the resulting mean population usage of insecticide-treated nets (ITNs) (panels B and D) are shown.

