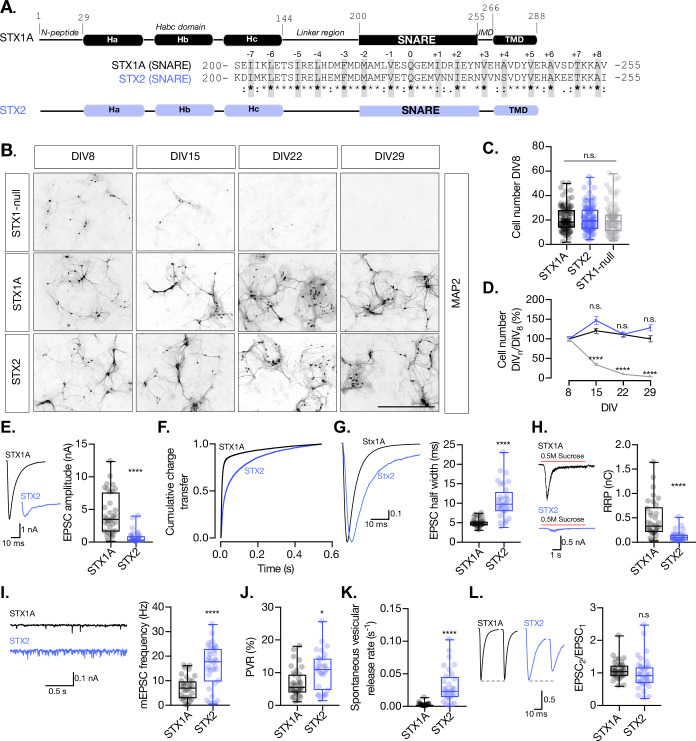
Figure 1. STX2 supports neuronal viability but does not rescue synchronous evoked release, the readily releasable pool (RRP), or the clamping of spontaneous release.
(A) STX1A and STX2 domain structure scheme and SNARE domain sequence alignment (68% homology). Layers are highlighted in gray. (B) Example images of high-density cultured STX1-null hippocampal neurons rescued with GFP (STX1-null), STX1A, or STX2 (from top to bottom) at days in vitro (DIV)8, DIV15, DIV22, and DIV29 (from left to right). Immunofluorescent labeling of MAP2. Scale bar: 500 μm. (C) Quantification of total number of neurons at DIV8 of each group. (D) Quantification of the percentage of the surviving neurons at DIV8, DIV15, DIV22, and DIV29 normalized to the number of neurons at DIV8 in the same group. (E) Example traces (left) and quantification of excitatory postsynaptic current (EPSC) amplitude (right) from autaptic Stx1A-null hippocampal mouse neurons rescued with STX1A or STX2. (F) Quantification of the cumulative charge transfer of the EPSC from the onset of the response until 0.55 s after. (G) Example traces of normalized EPSC to their peak amplitude (left) and quantification of the half-width of the EPSC (right). (H) Example traces (left) and quantification of the response induced by a 5 s 0.5 M application of sucrose, which represents the RRP of vesicles. (I) Example traces (left) and quantification of the frequency of the miniature EPSC (mEPSC) (right). (J) Quantification of the vesicle release probability (PVR) as the ratio of the EPSC charge over the RRP charge (PVR). (K) Quantification of the spontaneous vesicular release rate as the ratio between the mEPSC frequency and number of vesicles in the RRP. (L) Example traces (left) and the quantification of a 40 Hz paired-pulse ratio (PPR). In (D), data points represent mean ± SEM. In (D, E–L), data is shown as a whisker-box plot. Each data point represents single observations, middle line represents the median, boxes represent the distribution of the data, and external data points represent outliers. In (C, D), significances and p-values of data were determined by nonparametric Kruskal–Wallis test followed by Dunn’s post hoc test; *p≤0.05, **p≤0.001, ***p≤0.001, ****p≤0.0001. In (E–L), significances and p-values of data were determined by nonparametric Mann–Whitney test and unpaired two-tailed t-test; *p≤0.05, **p≤0.01, ***p≤0.001, ****p≤0.0001. All data values are summarized in Figure 1—source data 1.


