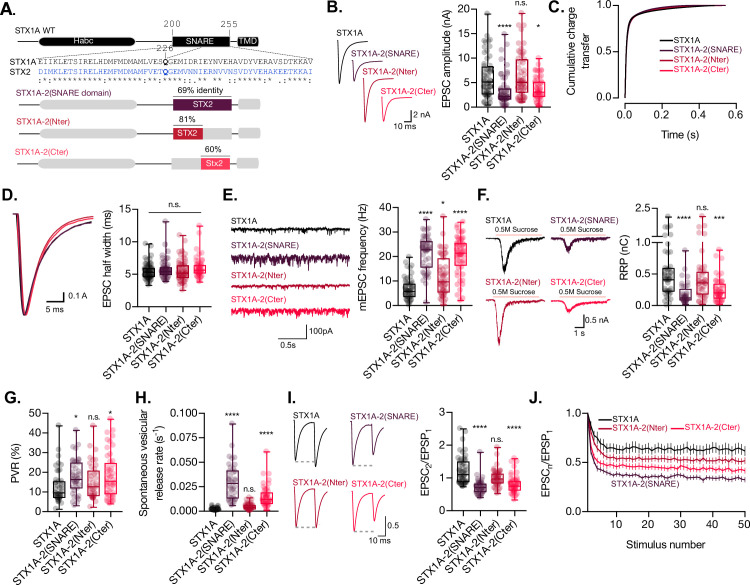
Figure 2. The C-terminal half of the SNARE domain of STX1A has a regulatory effect on the readily releasable pool (RRP), spontaneous release, and both, and N- and C-terminus have a role in the regulation of efficacy of Ca2+-evoked release.
(A) STX1A WT and chimera domain structure scheme, sequence alignment of STX1A and STX2 SNARE domain, and percentage homology between both SNARE domains. (B) Example traces (left) and quantification of the excitatory postsynaptic current (EPSC) amplitude (right) from autaptic STX1A-null hippocampal mouse neurons rescued with STX1A, STX1A-2(SNARE), STX1A-2(Nter), or STX1A-2(Cter). (B) Quantification of the cumulative charge transfer of the EPSC from the onset of the response until 0.55 s after. (C) Example traces of normalized EPSC to their peak amplitude (left) and quantification of the half-width of the EPSC (right). (D) Example traces (left) and quantification of the frequency of the miniature EPSCs (mEPSC) (right). (E) Example traces (left) and quantification of the response induced by a 5 s 0.5 M application of sucrose, which represents the RRP of vesicles. (F) Quantification of the vesicle release probability (PVR) as the ratio of the EPSC charge over the RRP charge (PVR). (G) Quantification of the spontaneous vesicular release rate as the ratio between the mEPSC frequency and number of vesicles in the RRP. (H) Example traces (left) and the quantification of a 40 Hz paired-pulse ratio (PPR). (I) Quantification of STP measured by 50 stimulations at 10 Hz. In (B, D–I), data is shown as a whisker-box plot. Each data point represents single observations, middle line represents the median, boxes represent the distribution of the data, where the majority of the data points lie, and external data points represent outliers. In (J), data represents the mean ± SEM. Significances and p-values of data were determined by nonparametric Kruskal–Wallis test followed by Dunn’s post hoc test; *p≤0.05, **p≤0.01, ***p≤0.001, ****p≤0.0001. All data values are summarized in Figure 2—source data 1.


