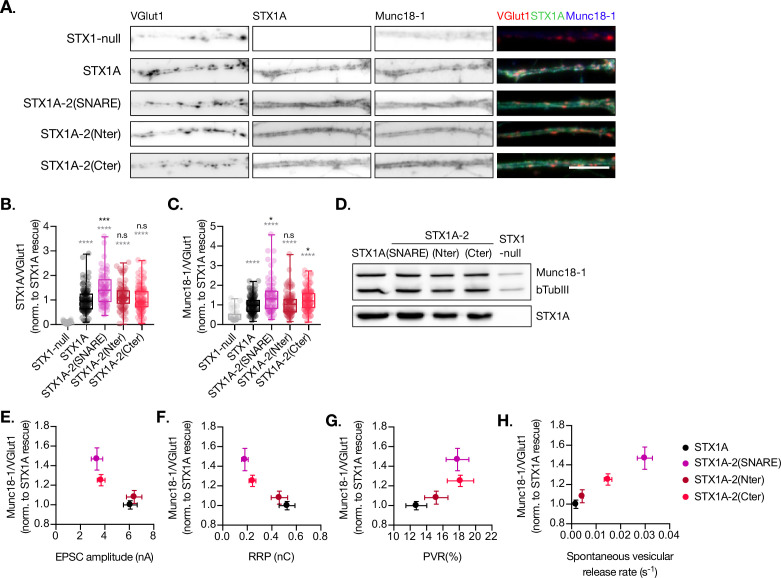
Figure 4. Quantification of STX1A and Munc18-1 levels at the synapse.
(A) Example images of Stx1-null neurons plated in high-density cultures and rescued with STX1A, STX1A-2(SNARE), STX1A-2(Nter), or STX1A-2(Cter) or GFP (STX1-null) as negative control. Neurons were fixed between days in vitro (DIV)14–16. Cultures were stained with fluorophore-labeled antibodies that recognize VGlut1 (red in merge), STX1A (green in merge), and Munc18-1 (blue in merge), from left to right. Scale bar: 10 μm. (B) Quantification of the immunofluorescent intensity of STX1A normalized to the intensity of the same VGlut1-labeled ROIs. Values were normalized to values in the STX1A rescue group. (C) Quantification of the immunofluorescent intensity of Munc18-1 normalized to the intensity of the same VGlut1-labeled ROIs. Values were normalized to values in the STX1 rescue group. (D) SDS-PAGE of the electrophoretic analysis of neuronal lysates obtained from each experimental group. Proteins were detected using antibodies that recognize β-tubuline III as loading control, STX1A, and Munc18-1. (E) Correlation between Munc18-1 values and excitatory postsynaptic current (EPSC) amplitude of Stx1-null neurons expressing STX1A, STX2, STX2-1A(SNARE), STX2-1A(Nter), or STX2-1A(Cter). (A) Correlation between Munc18-1 values and readily releasable pool (RRP). (B) Correlation between Munc18-1 values and probability of release (PVR). (C) Correlation between Munc18-1 values and spontaneous vesicular release rate. In (B, C), data is shown as a whisker-box plot. Each data point represents single ROIs, middle line represents the median, boxes represent the distribution of the data, where the majority of the data points lie, and external data points represent outliers. In (E–H), each data point is the correlation of the mean ± SEM. Significances and p-values of data were determined by nonparametric Kruskal–Wallis test followed by Dunn’s post hoc test; *p≤0.05, **p≤0.01, ***p≤0.001, ****p≤0.0001. All data values are summarized in Figure 4—source data 1.

