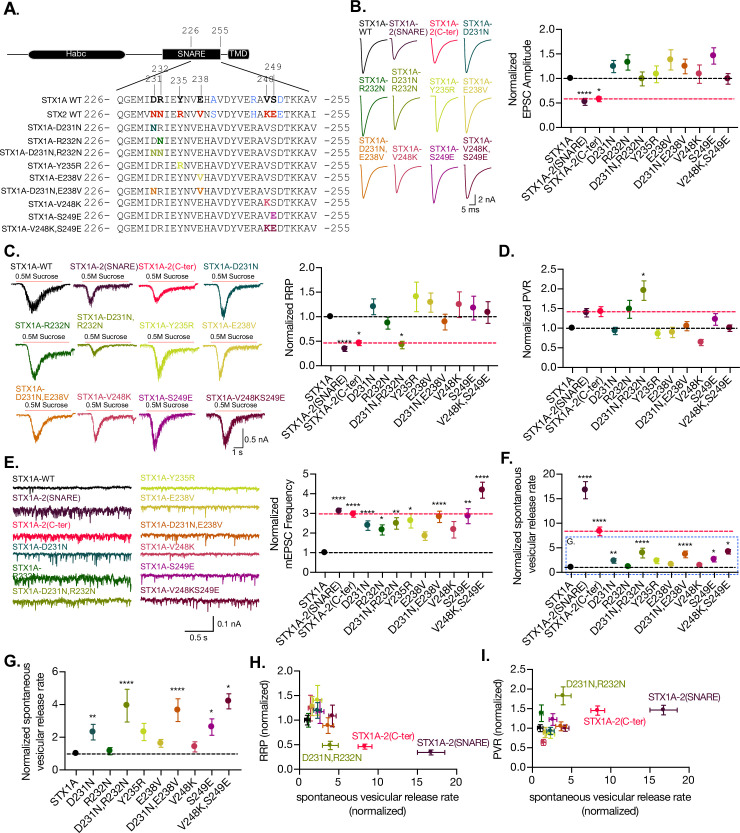
Figure 6. The charge in the outer-surface residues in the C-terminal half of the SNARE domain is important for clamping spontaneous release, and D231,R232 are important in the stabilization of the pool and the efficiency of Ca2+-evoked release.
(A) Sequence of the C-terminal half of STX1A and STX2 and single- and double-point mutations in the sequence of STX1A WT. (B) Example traces (left) and quantification of the excitatory postsynaptic current (EPSC) amplitude (right) from autaptic STX1A-null hippocampal mouse neurons rescued with STX1A, STX1AD231N, STX1AR232N, STX1AY235R, STX1AE238V, STX1AV248K, STX1AS249E STX1AD231N,R232N, and STX1AV248K,S249E. (C) Example traces (left) and quantification of the response induced by a 5 s 0.5 M application of sucrose, which represents the readily releasable pool of vesicles (RRP). (D) Quantification of the vesicle release probability (PVR) as the ratio of the EPSC charge over the RRP charge (PVR). (E) Example traces (left) and quantification of the frequency of the miniature EPSC (mEPSC) (right). (F) Quantification of the spontaneous vesicular release rate as the ratio between the mEPSC frequency and number of vesicles in the RRP. (G) Quantification of the spontaneous vesicular release rate as the ratio between the mEPSC frequency and number of vesicles in the RRP but STX1A-2(SNARE) and STX1A-2(Cter) chimeras were removed. (H) Correlation between the RRP and the spontaneous vesicular release rate. Both values are normalized to STX1A WT. (I) Correlation between the PVR and the spontaneous vesicular release rate. Values are normalized to STX1A WT. (B–H) All electrophysiological recording were done on autaptic neurons. Between 30 and 35 neurons per group from three independent cultures were recorded. Values from the STX1A-2(SNARE) and STX1A-2(Cter) groups were taken from the experiments done in Figure 2 and normalized to their own STX1A WT control and used here for visual comparison. Data points represent the mean ± SEM. Significances and p-values of data were determined by nonparametric Kruskal–Wallis test followed by Dunn’s post hoc test; *p≤0.05, **p≤0.01, ***p≤0.001, ****p≤0.0001. All data values are summarized in Figure 6—source data 1.


