. 2024 Mar 21;12:RP93246. doi: 10.7554/eLife.93246

Figure 4. Virtual histology analysis.

The regional correspondence between metabolic syndrome (MetS) effects (bootstrap ratio) and cell type-specific gene expression profiles was examined via an ensemble-based gene category enrichment analysis. (a) Barplot displaying spatial correlation results. The bar height displays the significance level. Colors encode the aggregate z-transformed Spearman correlation coefficient relating the Schaefer100-parcellated bootstrap ratio and respective cell population densities. Asterisks indicate statistical significance. The significance threshold of pFDR <0.05 is highlighted by a vertical dashed line. (b) Scatter plots illustrating spatial correlations between MetS effects and exemplary cortical gene expression profiles per cell population significantly associated across analyses – i.e., endothelium, microglia, and excitatory neurons type 8. Top 5 genes most strongly correlating with the bootstrap ratio map were visualized for each of these cell populations. Icons in the bottom right of each scatter plot indicate the corresponding cell type. A legend explaining the icons is provided at the bottom. First row: endothelium; second row: microglia; third row: excitatory neurons type 8. Virtual histology analysis results for the bootstrap ratios of latent variables 2 and 3 are shown in Figure 4—figure supplement 1. A corresponding plot illustrating the contextualization of the t-statistic derived from group statistics is shown in Figure 4—figure supplement 2. Abbreviations: -log(pFDR) – negative logarithm of the false discovery rate-corrected p-value derived from spatial lag models (Dukart et al., 2021; Burt et al., 2018); r – Spearman correlation coeffient. Z(rsp) – aggregate z-transformed Spearman correlation coefficient.

Figure 4.

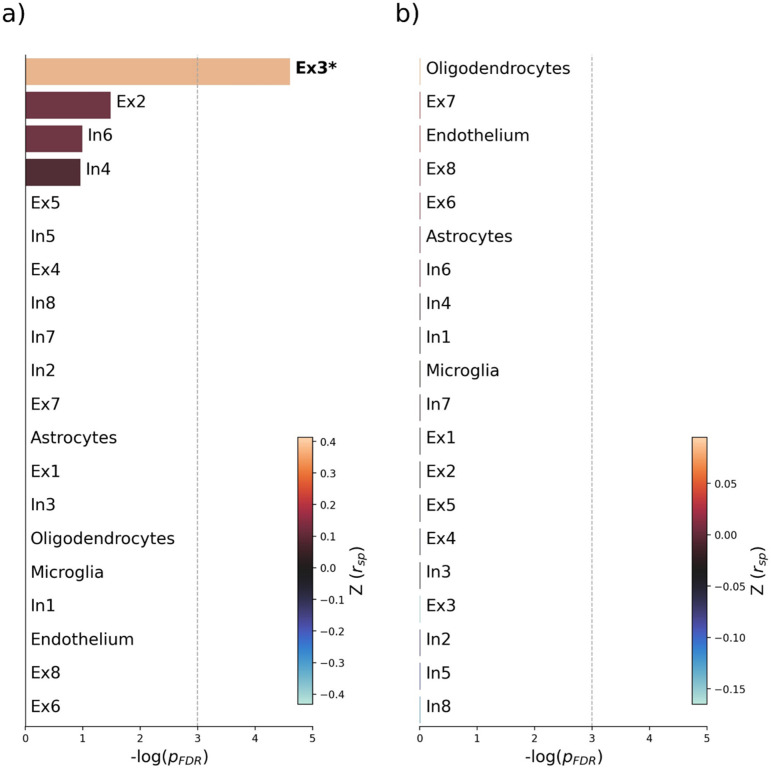
Figure 4—figure supplement 1. Virtual histology analysis of latent variables 2 and 3.

Figure 4—figure supplement 1.

Virtual histology analysis of the bootstrap ratio maps of latent variables 2 and 3 from the partial least squares (PLS) main analysis. Barplots display spatial correlation results of the bootstrap ratio of latent variables 2 and 3 and respective cell population densities computed via ensemble-based gene category enrichment analysis. (a) Results corresponding with the bootstrap ratio of latent variable 2. (b) Results corresponding with the bootstrap ratio of latent variable 3. Abbreviations: -log(pFDR) – negative logarithm of the false discovery rate-corrected p-value derived from spatial lag models; r – Spearman correlation coefficient. Z(rsp) – aggregate z-transformed Spearman correlation coefficient.
Figure 4—figure supplement 2. Sensitivity virtual histology analysis based on t-statistic map from group comparison.

Figure 4—figure supplement 2.

Virtual histology analysis of the t-statistic map derived from group comparison between individuals with metabolic syndrome and controls. (a) Barplot displaying spatial correlation results of the bootstrap ratio and respective cell population densities computed via ensemble-based gene category enrichment analysis. (b) Scatter plots illustrating per significantly associated cell population exemplary genes with top 5-highest correlation coefficients with the t-statistic map per significantly associated cell population across analyses (i.e. endothelium, microglia, excitatory neurons 8). Icons in the bottom right of each scatter plot indicate the corresponding cell type. First row: endothelium; second row: microglia; third row: excitatory neurons type 8. Abbreviations: -log(pFDR) – negative logarithm of the false discovery rate-corrected p-value derived from spatial lag models; r – Spearman correlation coefficient. Z(rsp) – aggregate z-transformed Spearman correlation coefficient.