. 2024 Mar 21;12:RP93246. doi: 10.7554/eLife.93246

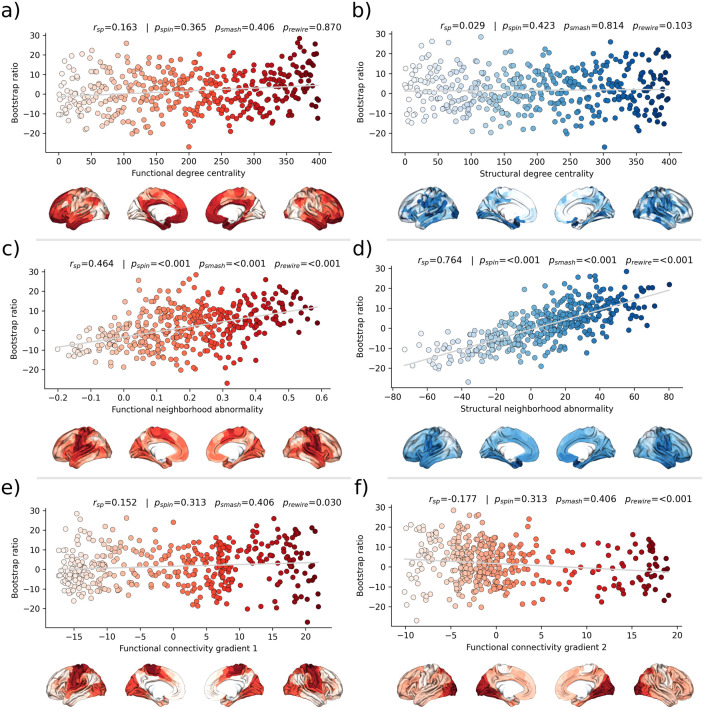
Figure 5. Brain network contextualization.

Spatial correlation results derived from relating Schaefer 400×7-parcellated maps of metabolic syndrome (MetS) effects (bootstrap ratio) to network topological indices (red: functional connectivity, blue: structural connectivity). Scatter plots that illustrate the spatial relationship are supplemented by surface plots for anatomical localization. The color coding of cortical regions and associated dots corresponds. (a and b) Functional and structural degree centrality rank. (c and d) Functional and structural neighborhood abnormality. (e and f) Intrinsic functional network hierarchy represented by functional connectivity gradients 1 and 2. Complementary results concerning t-statistic maps derived from group comparisons between MetS subjects and controls are presented in Figure 5—figure supplement 1. Corresponding results after reperforming the analysis with HCHS-derived group-consensus connectomes are presented in Figure 5—figure supplement 2. Abbreviations: HCHS – Hamburg City Health Study; prewire - p-value derived from network rewiring (Maslov et al., 2004); psmash - p-value derived from brainSMASH surrogates (Burt et al., 2020); pspin - p-value derived from spin permutation results (Alexander-Bloch et al., 2018); rsp - Spearman correlation coefficient.

Figure 5.

Figure 5—figure supplement 1. Sensitivity network contextualization analysis based on t-statistic map derived from group comparison.

Figure 5—figure supplement 1.

Brain network contextualization analysis of group statistics results. Results are presented for t-statistics maps derived from group statistics considering the pooled sample of UK Biobank subjects and Hamburg City Health Study (HCHS) subjects. The upper row barplot summarizes the analysis results displaying the Spearman correlation with regard to each investigated index. Asterisks indicate statistical significance with respect to spin, brainSMASH, and network rewiring null models. The middle and lower rows display scatter plots of the significant association of the t-statistics map and the functional and structural neighborhood abnormality, respectively. The scatter plots are supplemented by surface plots for anatomical localization. Abbreviations: prewire - p-value derived from network rewiring (Maslov et al., 2004); psmash - p-value derived from brainSMASH surrogates (Burt et al., 2020); pspin - p-value derived from spin permutation results (Alexander-Bloch et al., 2018); rsp - Spearman correlation coefficient.
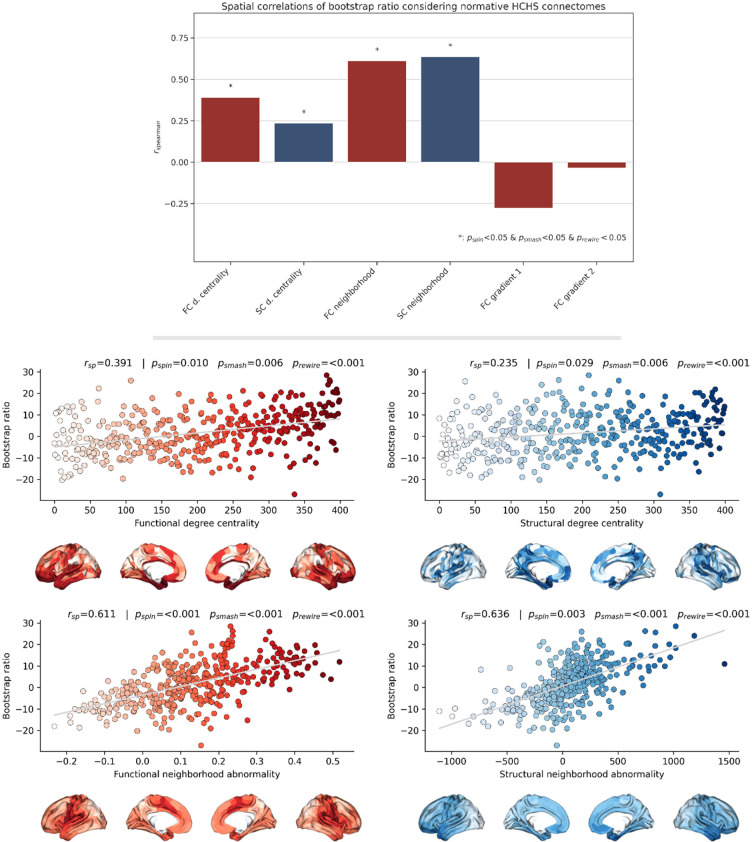
Figure 5—figure supplement 2. Sensitivity network contextualization analysis based on group-consensus connectomes from the Hamburg City Health Study.

Figure 5—figure supplement 2.

Brain network contextualization analysis of partial least squares correlation results (bootstrap ratio) based on group-consensus connectomes from the Hamburg City Health Study. Results are presented for bootstrap ratio maps derived from partial least squares correlation analysis considering the pooled sample. The upper row bar plot summarizes the analysis results displaying the Spearman correlation with regard to each investigated index. Asterisks indicate statistical significance with respect to spin, brainSMASH, and network rewiring null models. Scatter plots that illustrate the significant spatial relationships are presented below. The middle row displays the relationship of the bootstrap ratio map and the ranked functional and structural degree centrality. The lower row illustrates the association of the bootstrap ratio map and the functional and structural neighborhood abnormality. Abbreviations: prewire - p-value derived from network rewiring (Maslov et al., 2004); psmash - p-value derived from brainSMASH surrogates (Burt et al., 2020); pspin - p-value derived from spin permutation results (Alexander-Bloch et al., 2018); rsp - Spearman correlation coefficient.