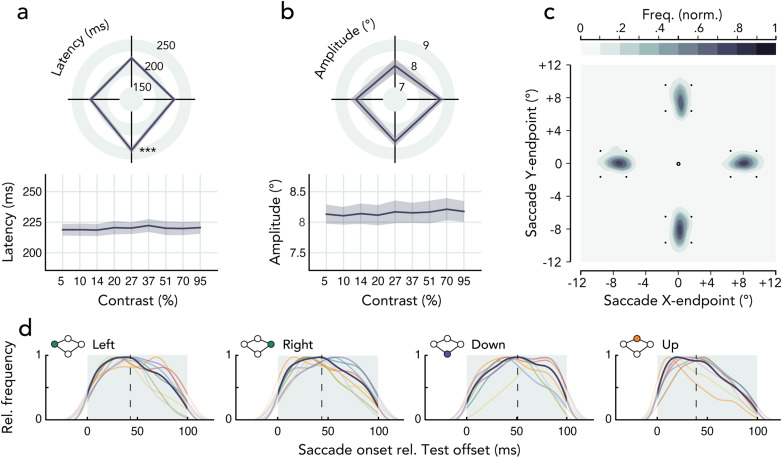
Figure 3.
Eye movement parameters. Group average saccade latency (a) and amplitude (b) as a function of saccade direction (top) and test contrast level (bottom). The shaded error areas indicate ±1 SEM. c, Normalized saccade endpoint frequency maps averaged across observers depicting saccade landing variance. d, Density plots of saccade onset times relative to test offset, for each observer (thin colored lines) and across observers (bold line). The dashed vertical lines indicate the average saccade onset across observers; the gray background indicates the time window of trials included in the analysis (test offset ≤100 ms before saccade onset).

