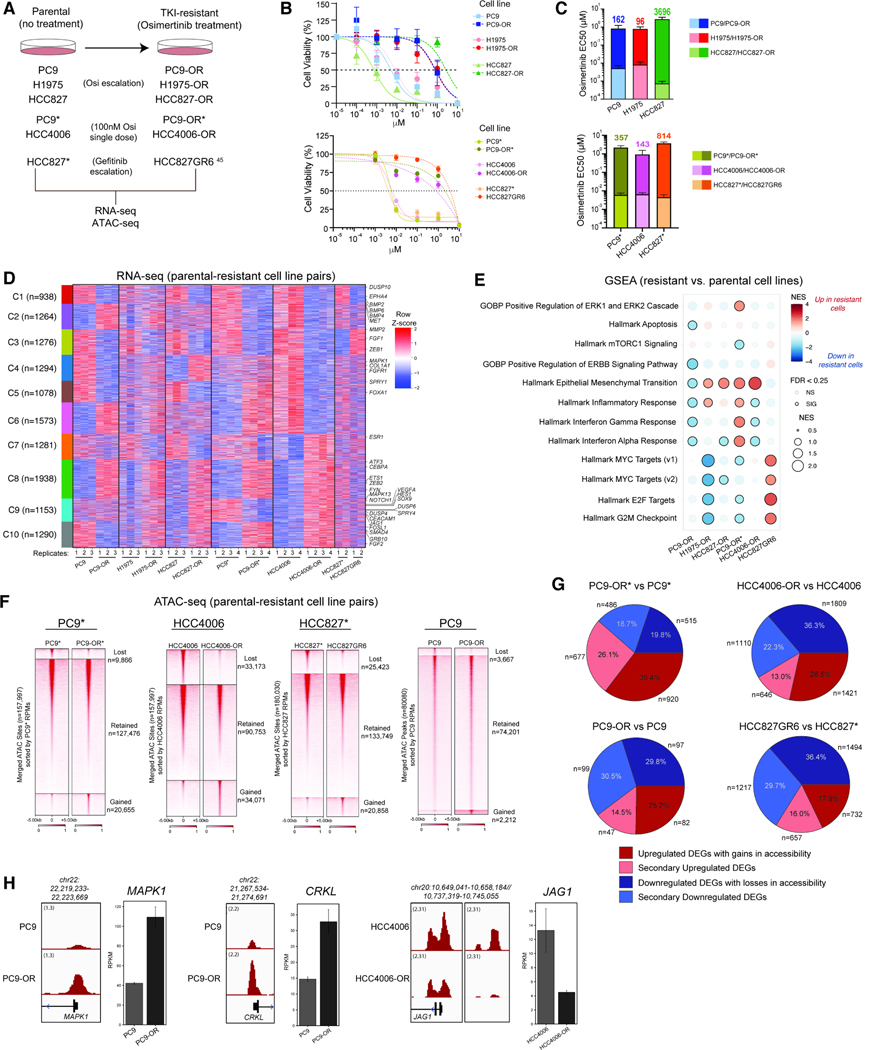
Figure 1. Chromatin accessibility and gene regulatory underpinnings of osimertinib resistance in EGFR-mutant lung cancer cell lines.
A. Schematic representation of the generation of the TKI- resistant cell lines. B. Osimertinib dose-response curves for the parental cell lines and their TKI-resistant counterparts (n=3 experimental replicates; mean ± SEM is shown). C. Bar graphs (mean ± SEM) of EC50 values for parental and TKI-resistant isogenic cell line pairs. The fold-change in osimertinib EC50 values between resistant and parental cells is indicated. D. Clustered heatmap performed on n=2–4 RNA-seq profiles (raw RPKM) from all parental and resistant cell line pairs. Examples of significant genes are labeled. RPKM signals were z-scored separately within each cell line pair and combined horizontally to highlight differences between parental and resistant states. E. GSEA for pathway enrichment using DEGs from parental and resistant cell line pairs. F. Heatmap representation of ATAC-seq peaks in PC9*, HCC4006, HCC827* and PC9 parental cell lines and their resistant counterparts sorted by RPKM values over all accessible genomic sites. G. Pie chart representation of proportion of DEGs (resistant cell line vs parental) near concordantly changed ATAC-seq peaks in PC9*, HCC4006, HCC827* and PC9 cell line pairs. H. ATAC-seq tracks over the MAPK1, CRKL and JAG1 loci in the PC9 and HCC4006 cell line pairs. Gene expression RPKM values are shown in bar graphs. Error bars represent the 95% confidence interval around the mean expression level for each cell line. See also Figure S1.

