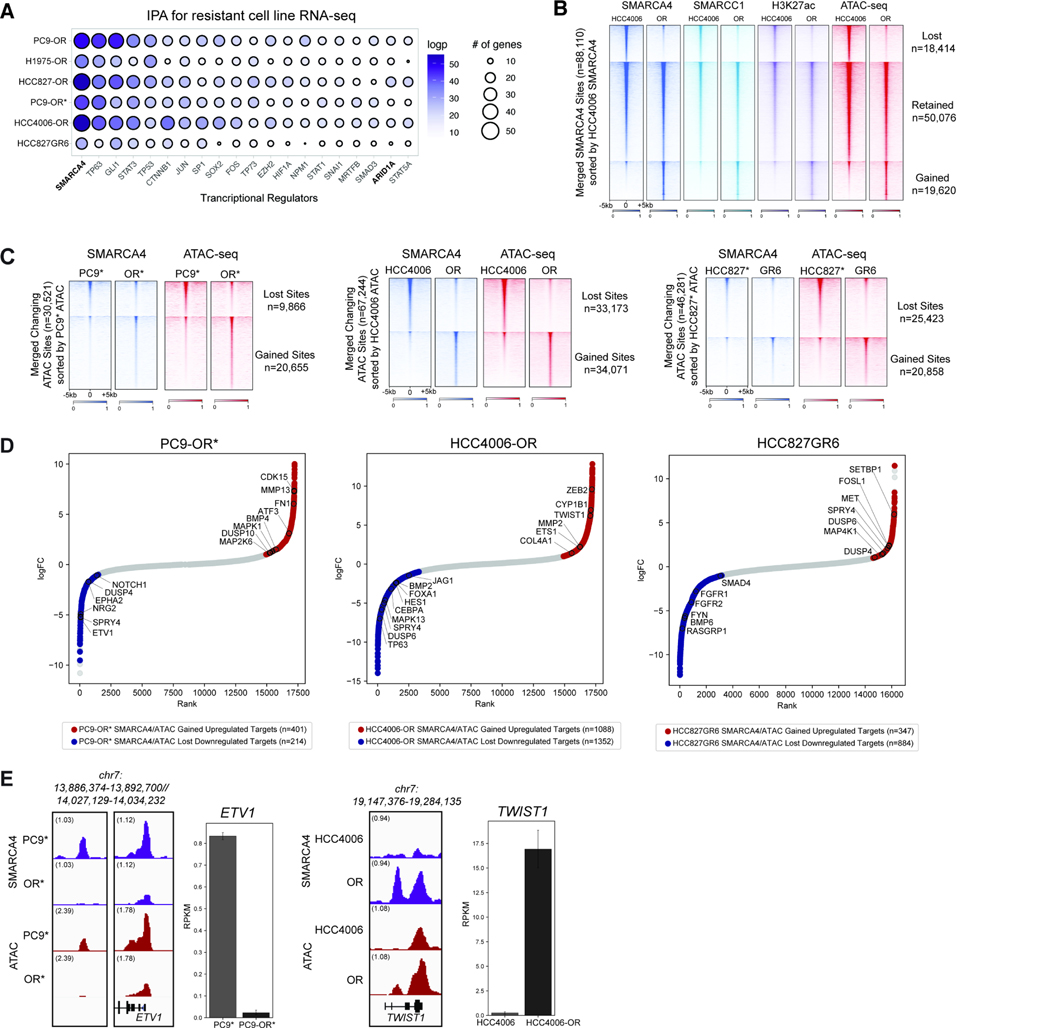
Figure 2. Mammalian SWI/SNF (BAF) complexes as critical regulators of resistance-associated gene loci.
A. Ingenuity Pathway Analysis (IPA) performed on differentially-regulated genes in parental versus resistant cell line pairs. Top 20 most significant transcriptional upstream regulators are shown; Circle size indicates the number of genes regulated. Circle color represents significance as measured by logpvalue <0.05. B. Heatmap for SMARCA4, SMARCC1, and H3K27ac occupancy (CUT&RUN) levels and ATAC-seq chromatin accessibility in HCC4006/HCC4006-OR cell lines across merged SMARCA4 sites. C. Heatmap displaying SMARCA4 occupancy levels and ATAC-seq chromatin accessibility in PC9*/PC9-OR*, HCC4006/HCC4006-OR and HCC827*/HCC827GR6 cell lines, across merged differential ATAC-seq sites. D. Hockey-stick plots representing the normalized rank and signals of RNA-seq in PC9-OR*, HCC4006-OR and HCC827GR6 cell lines. Representative SMARCA4/ATAC gained-associated genes that are upregulated are in red and representative BAF/ATAC lost-associated genes that are downregulated are in blue. E. SMARCA4 and ATAC-seq tracks at the ETV1 (in PC9*/OR*) and TWIST1 (in HCC4006/OR) loci. RNA-seq expression signal (RPKM) is shown for each; error bars represent the 95% confidence interval around the mean expression level. See also Figure S2.

