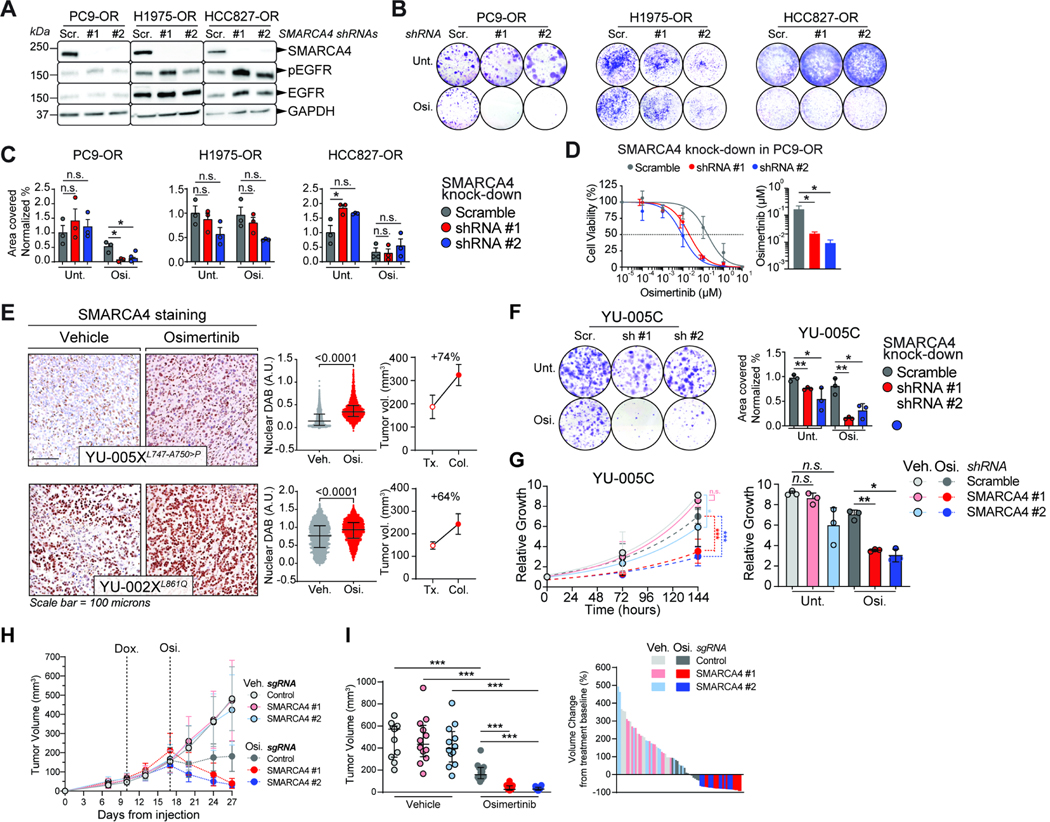
Figure 3. SMARCA4 loss sensitizes a subset of resistant tumors to osimertinib.
A. Western blots of OR cells transduced with SMARCA4-targeting shRNAs. Scramble (Scr.); SMARCA4 knockdown (#1 and #2). B-C. Representative colony formation assay in OR cells. (B). Quantification of the results for independent triplicates (C). Osimertinib doses: 750 nM (PC9-OR, HCC827-OR); 1500 nM (H1975-OR). D. Osimertinib dose-response curves for PC9-OR cells after 7 days of SMARCA4 knockdown. Significance was calculated using a paired t test and the Mean ± SEM is shown. *P<0.05. E. IHC staining for SMARCA4 on PDXs treated either with vehicle or osimertinib (left). Quantification of diaminobenzidine (DAB) intensity (middle) A.U., arbitrary units. Tumor volume change from the start of treatment (Tx.) to the day the tumor was collected (Col.) (right). F. Representative colony formation assay in YU-005C cells after one-week of SMARCA4 knock-down (left). Quantification of data from independent triplicates is shown (right). G. Proliferation curves of YU-005C cells one week after shRNA induction (left). Plot of the relative growth of the cells at the proliferation assay end-point. Data from three independent replicates are shown (right). H-I. Tumor volume of YU-005C cells injected subcutaneously in mice (left). ime-Dox., initiation of doxycycline to knock-out SMARCA4. Osi., start of osimertinib treatment. Tumor volume after two weeks of osimertinib treatment (middle). Waterfall plot after 2 weeks of osimertinib treatment (right). Significance was calculated using a Mann-Whitney test and the Median ± IQR for C, F-G. Significance was calculated using a paired t test and the Mean ± SEM is shown in I. ***P<0.001, **P<0.01, *P<0.05. See also Figure S3.

