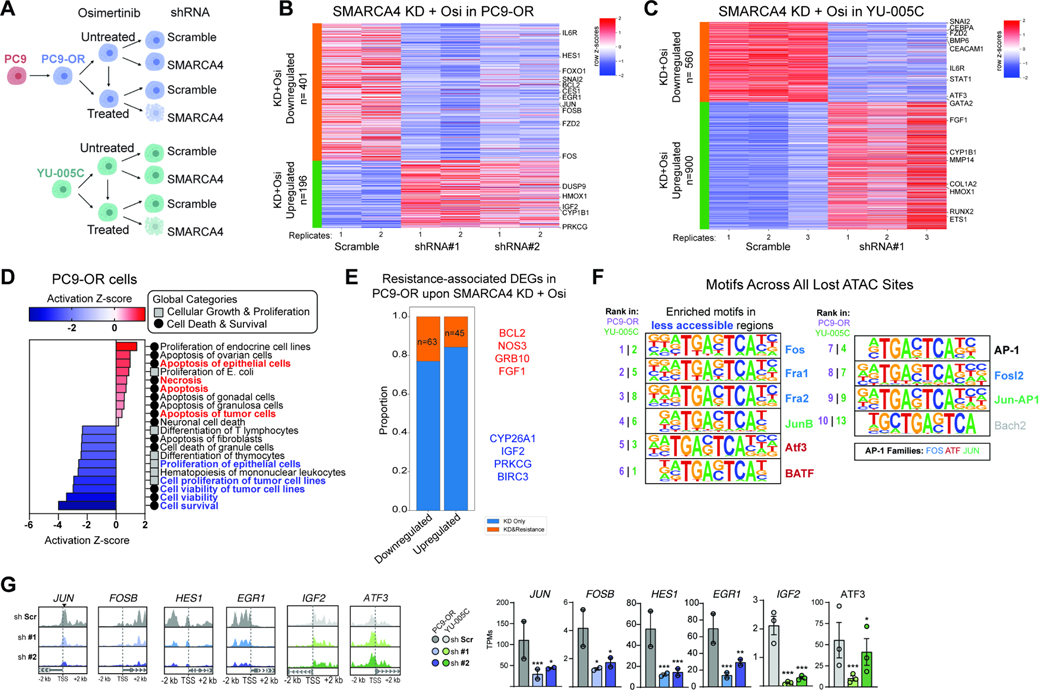
Figure 4. SMARCA4 suppression in osimertinib-resistant cell lines regulates resistance-associated genes.
A. Experimental design for SMARCA4 knockdown (KD) in PC9-OR and YU-005C cells. Seven days after knockdown the cells were treated with osimertinib for 72 hours. B-C. Heatmaps reflecting row Z-score values for up- and- down- regulated genes in PC9-OR and YU-005C cells following SMARCA4 knockdown and osimertinib treatment. Top gene hits are indicated. D. Heatmap generated by IPA reflecting Z-scored enrichment of gene pathways affected in osimertinib treated PC9-OR cells upon SMARCA4 knockdown. E. Stacked bar graph depicting number of resistance-associated genes impacted by SMARCA4 knockdown + osi treatment in PC9-OR cells. Key up- and down-regulated genes are in red and blue, respectively. F. Motifs under differentially-accessible sites genome-wide in osimertinib treated PC9-OR (purple rank) and YU-005C (green rank) cells upon SMARCA4 KD. G. Representative ATAC-seq tracks and bar graphs showing altered gene expression for key resistance-associated genes. Mean ± SEM. Significance was calculated using DESeq2. ***P<0.001, *P<0.05. See also Figure S4.

