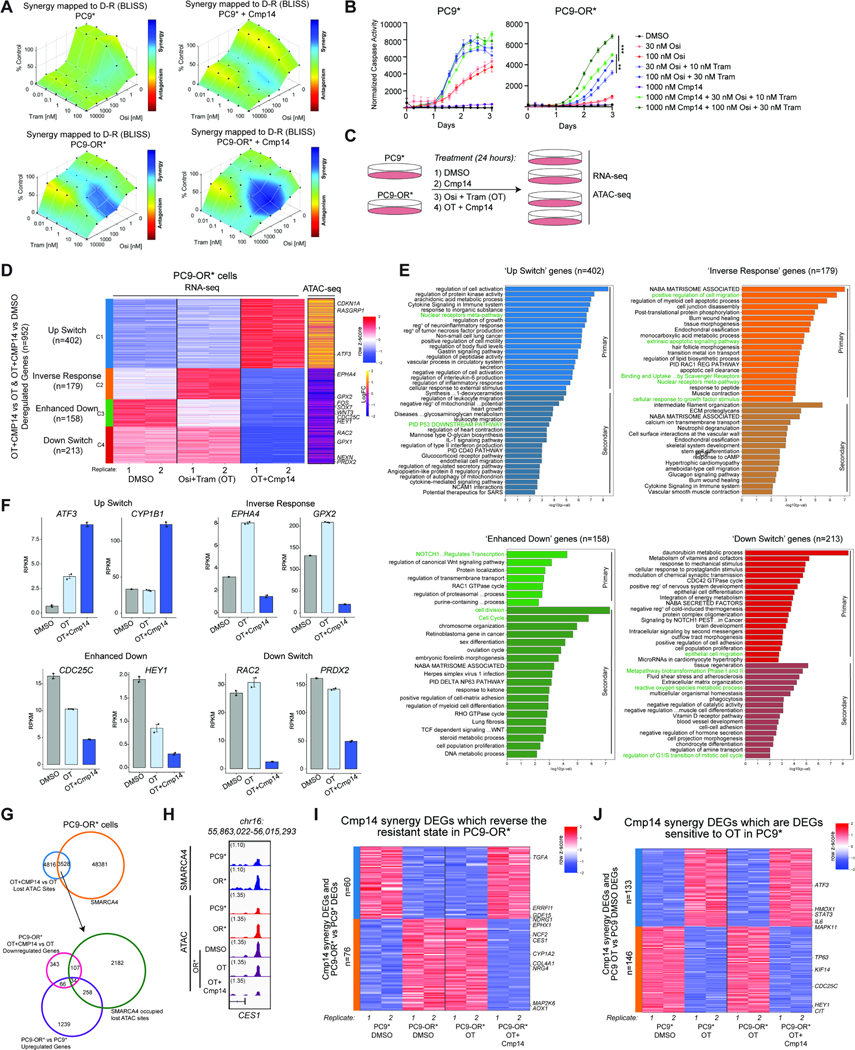
Figure 5. Pharmacologic targeting of mSWI/SNF complex ATPase activity reverses the TKI resistance program in a subset of EGFR-mutant cancer cell lines.
A. Drug synergy plots in PC9* and PC9-OR* cells as assayed by Combenefit software. Bliss synergy scores were calculated for each drug combination, osimertinib (osi) and trametinib (Tram) in the absence or presence of Compound14 (Cmp14) after 72 hours. One representative experiment out of N=3 independent experiments is shown. B. Caspase-3/7 activity assays performed in PC9* and PC9-OR* cells across 3 days of drug treatment. A low and high concentration of osi and tram were used in these assays to highlight enhanced sensitization effects. Graphs represent fluorescent signals normalized to cellular confluency at each timepoint. One representative experiment out of N=5 independent experiments is shown. Data presented as Mean ± SEM with significance calculated at the last timepoint using an unpaired t test ***P<0.0005, **P<0.005. C. Experimental design for ATAC-seq and RNA-seq performed in PC9* and PC9-OR* cells following 24 hours of each treatment. D. RNA-seq clustered heatmap of Cmp14 synergy genes in PC9-OR* cells. Biological replicates are represented for DMSO, OT and OT+Cmp14 treatments. Expression signals were z-scored across the samples. Genes were k-means clustered (k=4) and clusters were reordered. The greatest coordinated ATAC-seq changes (in logFCs) between OT+CMP14 and OT in PC9-OR* for each gene are shown as a yellow/purple heatmap. Select genes are labeled. E. Metascape analysis of genes from each cluster of Cmp14 synergy genes separated by correlation to ATAC-seq signal. Primary analysis represents DEGs which have a closest associated change in ATAC peak while secondary analysis represents DEGs without an associated ATAC peak change. Cluster specific or common terms are highlighted. F. Bar graphs of key deregulated Cmp14 synergy genes from each RNA-seq cluster from (D) showing average RPKM values for each condition with one SEM for the error bars. G. Venn diagram representation of SMARCA4 occupied sites in PC9-OR* cells which overlap with lost ATAC sites at Cmp14 synergy DARs (upper). A subset of these sites overlap with upregulated DEGs which characterize the resistant state (PC9-OR* vs PC9*) and are subsequently downregulated by Cmp14 synergy treatment (lower). H. IGV tracks of SMARCA4 occupancy (Cut&Run) and accessibility (ATAC-seq) at the CES1 locus. I. RNA-seq heatmap of RPKM values of Cmp14 Synergy DEGs at resistant-state associated genes. Values are shown for PC9* and PC9-OR* cells under DMSO treatment as compared to PC9-OR* cells under OT and OT+Cmp14 treatments. J. RNA-seq heatmap of RPKM values of Cmp14 Synergy DEGs in PC9* cells under DMSO and OT treatments and in PC9-OR* cells under OT and OT+Cmp14 treatments. See also Figure S5.

