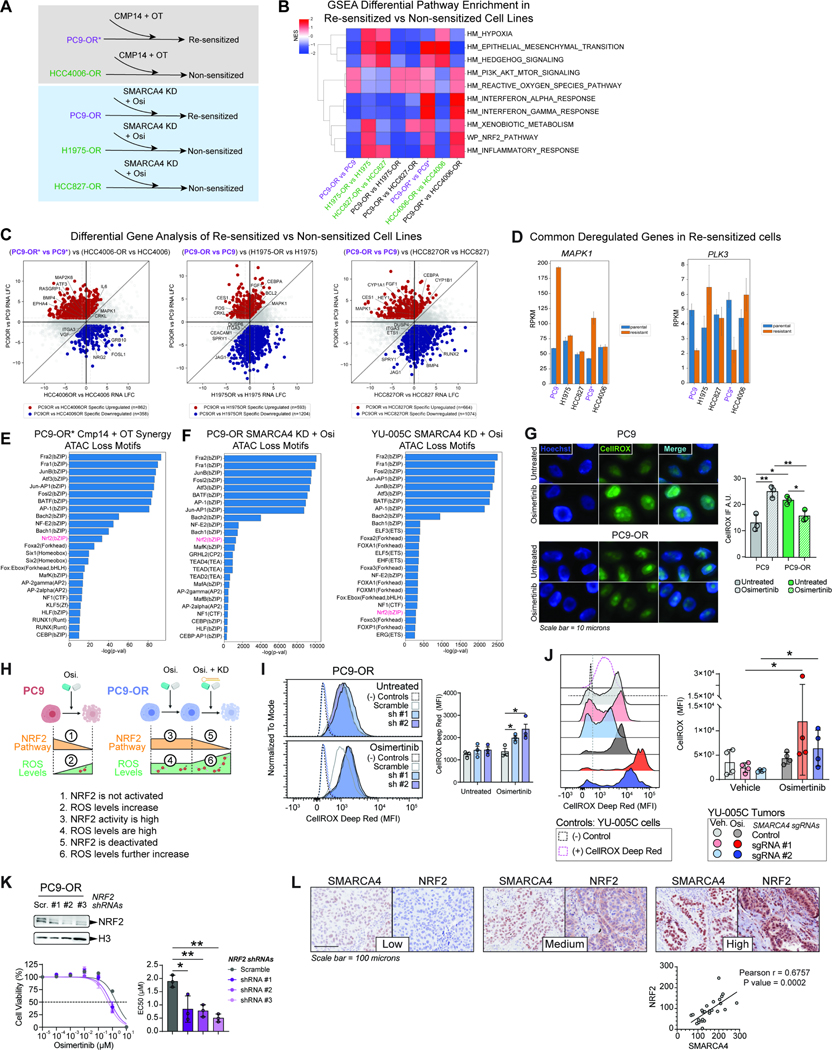
Figure 6. Resensitization of osimertinib-resistant cell lines reveals attenuation of reactive oxygen species by SMARCA4.
A. Schematic overview of cell lines which are responsive (resensitized; purple) and non-responsive (green) to osimertinib treatment upon inhibition or knock down of SMARCA4. B. GSEA pathway enrichment analysis of differentially expressed genes (DEGs) between each parental and osimertinib-resistant cell line pair as well as sensitized cell line DEGs vs. non sensitized cell line DEGs. C. Quadrant plots of differentially expressed genes specific to the resistant PC9-OR* state as compared to HCC4006-OR and specific to the resistant PC9-OR state as compared to H1975-OR and HCC827-OR. Upregulated genes (red), downregulated genes (blue). Gene examples are labelled. D. Bar graphs of key gene examples that are specifically upregulated and downregulated common to PC9-OR* and PC9-OR showing RPKM values across cell lines. E-F. Motif analysis of lost ATAC sites attributed to Cmp14+OT treatment in PC9-OR* cells (E) and attributed to SMARCA4 knock down in PC9-OR and YU-005C cells (F). G. Immunofluorescence images (IF) of cells stained using CellROX™ to quantify ROS in PC9 and PC9-OR cells in the presence and absence of 750 nM osimertinib. Hoechst staining was used to detect nuclear DNA (left). CellROX™ IF quantification of three independent replicates is shown (right). A.U., arbitrary units. H. Schematic model of ROS levels, NRF2 pathway activity, SMARCA4 regulation and osimertinib sensitivity. Upon osimertinib treatment NRF2 targets are downregulated, and ROS levels increase in PC9 cells (1 and 2). In treated PC9-OR cells NRF2 targets are activated, and ROS levels are high (3 and 4); upon SMARCA4 knockdown, NRF2 targets are downregulated and ROS levels further increase causing cellular toxicity. I-J. Flow cytometry using CellROX™ to measure ROS in PC9-OR cells (I) and in YU-005C tumors (J) in the presence and absence of osimertinib and with or without SMARCA4 knockdown. (−) Controls are from PC9-OR and YU-005C unstained cells respectively and (+) CellROX™ Deep Red control in (J) is from stained YU-005C cells. CellROX™ MFI was assessed in RFP+/shRNA-containing cells (I) and GFP+/sgRNA-containing cells (J). Representative MFI profile of CellROX™+ cells (I:, J: left). Quantification of three independent replicates (I: right) and four tumors (J: right). K. Western blot of PC9-OR cells transduced with three NRF2 shRNAs as indicated (upper). Osimertinib dose-response curves for PC9-OR cells after NRF2 knock-down (bottom left). Bar graph of EC50 values (bottom right). L. IHC staining for SMARCA4 and NRF2 in three representative cores of a TMA containing EGFR-mutant TKI-treated tumors (upper). Correlation plot of NRF2 and SMARCA4 H-Scores for all the tumors (lower). Significance was calculated using the Pearson r correlation test. Scr.: Scramble shRNA, sh #1: SMARCA4 shRNA #1; sh #2: SMARCA4 shRNA #2. Significance was calculated using a paired t test and the Mean ± SEM is shown in D, E and H. Significance was calculated using a Mann-Whitney test and the Median ± IQR is shown in F. **P<0.01, *P<0.05. See also Figure S6.

