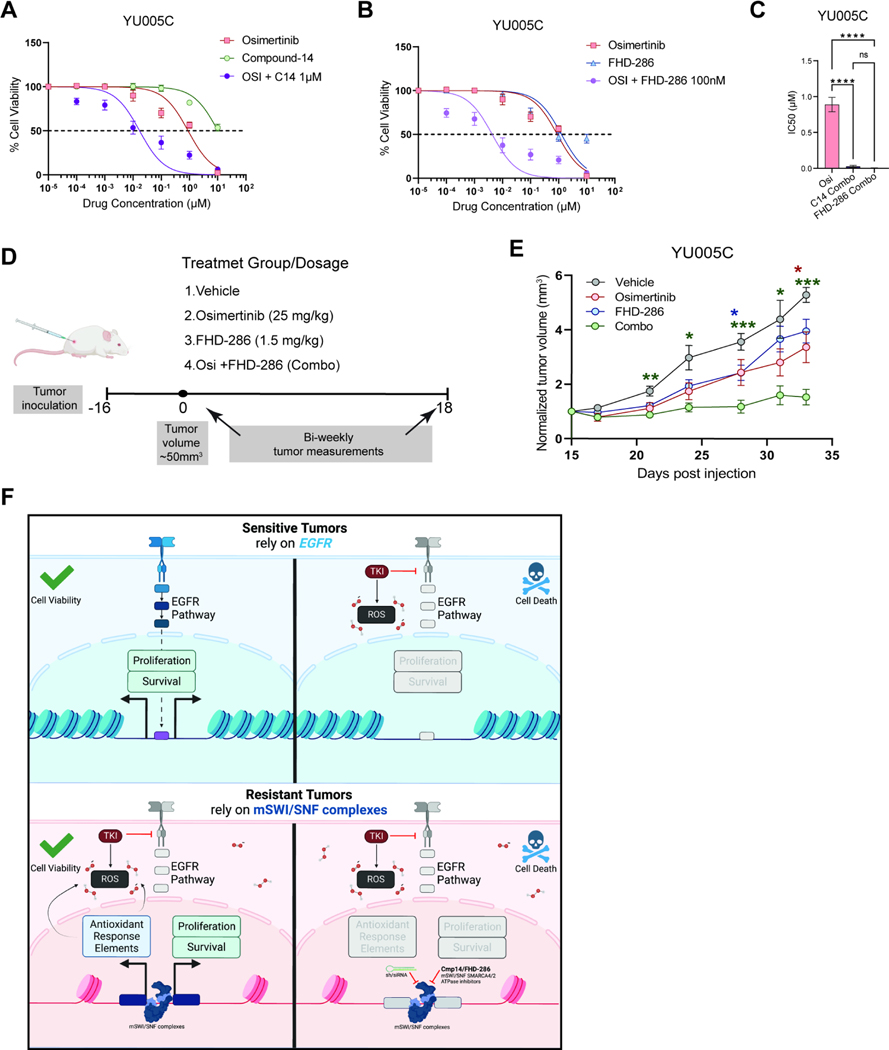
Figure 7. Pharmacological inhibition of mSWI/SNF ATPase activity sensitizes a patient-derived tumor to osimertinib.
A. Osimertinib, compound-14, and combination (titrated osimertinib + 1μM of Compound-14) dose-response curves for YU-005C cells. B. Osimertinib, FHD-286, and combination (titrated osimertinib + 100nM of FHD-286) dose-response curves for YU-005C cells. (A,B) N=4. The mean ± standard deviation is shown. C. Bar graph of IC50 values for YU-005C cells treated with osimertinib (alone), or in combination with compound-14 or FHD-286. The mean ± SEM is shown. Significance was calculated using the one-way repeated measures ANOVA test and Tukey’s multiple comparisons test. ***P<0.001, **P<0.01, *P<0.05. D. Experimental design. YU-005C cells were injected subcutaneously in mice that were treated with either vehicle, osimertinib, FHD-286 or the combination of both. E. Normalized tumor volume of YU-005C cells treated with either vehicle, osimertinib, FHD-286 or the combination. Individual tumor volumes reflect the change in volume from treatment baseline. Tumor volume mean and ± standard error of the mean is shown. Significance was calculated using the two-way repeated measures ANOVA test and Dunnett’s multiple comparisons test, with a single pooled variance. ***P<0.001, **P<0.01, *P<0.05. G. Schematic representation of the mechanistic model by which SMARCA4 promotes osimertinib resistance. Sensitive tumors rely on EGFR signaling pathway. Osimertinib blocks EGFR and generates ROS killing the cells. Resistant tumors rely on SMARCA4 to keep proliferating and neutralizing the accumulated ROS. Blocking SMARCA4 activity generates stress killing the cells. Created with Biorender.com. See also Figure S7.

