
Figure 5.
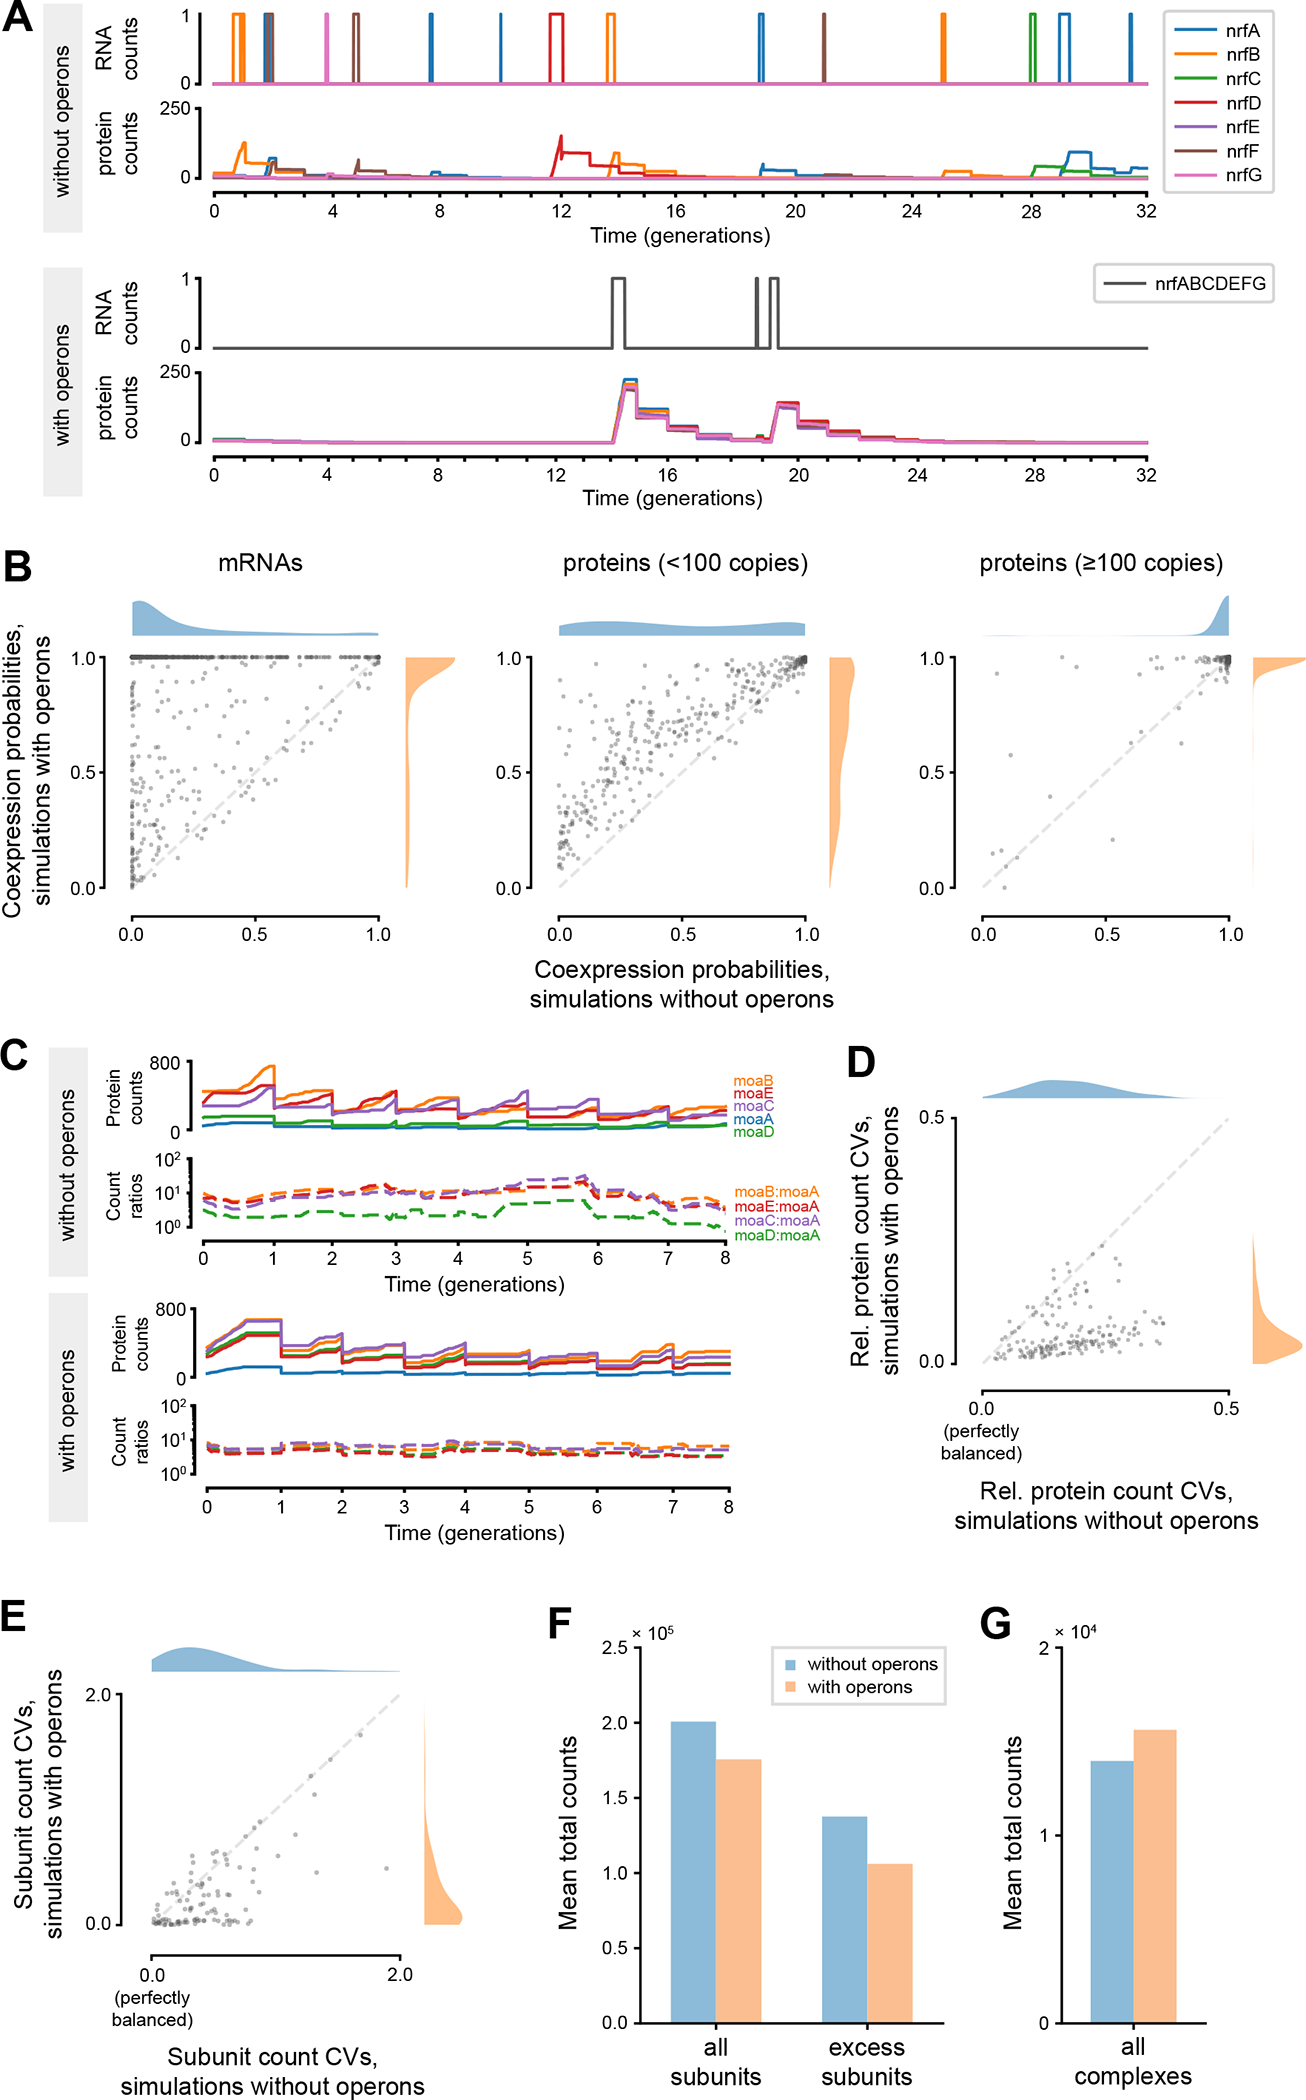
Comparisons between simulations with and without operons suggested possible benefits operons can bring to bacteria. (A) Simulated dynamics of mRNA and protein counts for genes in the nrfABCDEFG operon, in simulations without and with operons. (B) Comparisons of coexpression probabilities of each operon, between simulations with and without operons. Operons increase these probabilities at the mRNA level (left) and, for low-expression genes, at the protein level (middle), but not for high-expression genes at the protein level (right). See Table S3 for full data. (C) Simulated dynamics of absolute and relative protein counts for genes in the moaABDEC operon, in simulations without and with operons. (D) Comparison of coefficients of variation (CV) calculated from relative protein counts for each operon, between simulations with and without operons. See Table S4 for full data. (E) Comparison of coefficients of variation calculated from subunit counts normalized with complexation stoichiometries for each protein complex, between simulations with and without operons. See Table S5 for full data. (F) Comparison of total counts of all protein subunits and excess subunits between simulations with and without operons. (G) Comparison of total counts of all protein complexes between simulations with and without operons. In all panes, the reported values are averages of the respective values taken from each simulated cell with a fully completed cell cycle (n=768 for simulations without operons, n=758 for simulations with operons).