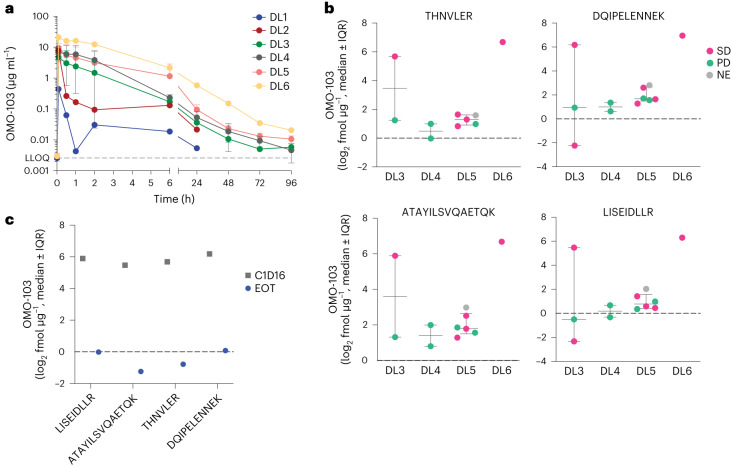
Fig. 2. PK of OMO-103 in serum and detection in patient biopsies.
a, PK profiles at different DLs following a single intravenous infusion of OMO-103 (n = 22). LLOQ, lower limit of quantification. Statistical average value and standard deviation are shown. b, Quantification of functional Omomyc by MS in FFPE on-treatment biopsies from MYCure patients for DL3–6 following administration of at least three intravenous infusions of OMO-103 (n = 12). The sequence of peptides used for detection of the Omomyc protein is indicated on top of the x axis. Median value and interquartile range (IQR) are shown. c, Results from end-of-treatment (EOT) biopsy of a patient with PDAC from DL3 who remained for >6 months in the study and had received their last infusion 19 days before biopsy, compared with those obtained at cycle 1, day 16 (C1D16). NE, not evaluable.

