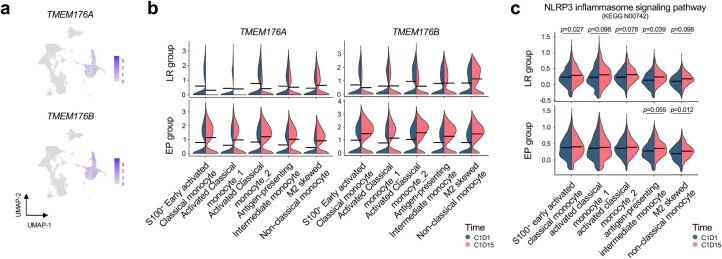
Extended Data Fig. 8. TMEM176A/B expression and expression levels of genes related to the NLRP3 inflammasome in monocytes upon regorafenib-nivolumab treatment.
a, UMAP plots showing normalized expressions of TMEM176A and TMEM176B in PBMCs. b, Violin plots showing the average expression of the TMEM176A and TMEM176B genes before and after treatment among long-term responders (LR; n = 15) and early progressors (EP; n = 13). c, Violin plots showing the module score for the gene set related to the NLRP3 inflammasome signaling pathway in each monocyte subcluster in LR (n = 9) and EP (n = 9). *P < 0.05, **P < 0.01, ***P < 0.005, ****P < 0.001, according to a two-sided Wilcoxon signed-rank test for paired groups.

