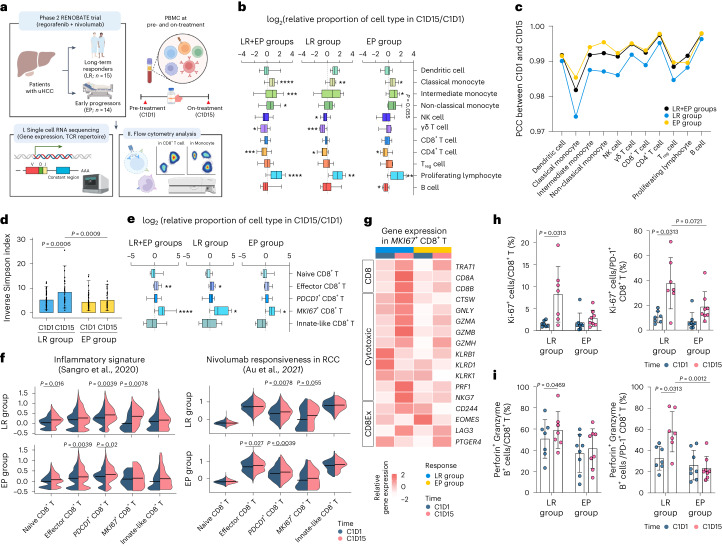
Fig. 3. Overall immune landscapes and dynamic changes of CD8+ T cell subsets in peripheral blood.
a, Schematic summary of the design of exploratory analyses. b, Box plots showing the fold change in proportions of immune cell types among PBMCs in long-term responders (LR; n = 9), early progressors (EP; n = 9) and both (n = 18). c, PCC of each cell type between C1D1 and C1D15. d, Bar plots showing the TCR diversity, as represented by the inverse Simpson index for CD8+ T cells in LR (n = 15) and EP (n = 14) between C1D1 and C1D15. e, Box plots showing the fold change in the proportions of CD8+ T cell subclusters among NK/T cells among LR (n = 9), EP (n = 9) and both (n = 18). f, Violin plots showing the module score for gene sets related to inflammatory signature (left) and nivolumab responsiveness in each CD8+ T cell cluster (right). g, Heat map showing expression levels of CD8 and genes related to cytotoxicity and T cell exhaustion among MKI67+CD8+ T cells. h, Proportion of Ki-67+ cells among CD8+ T cells and PD-1+CD8+ T cells, before and after treatment, among LR (n = 7) and EP (n = 8). i, Proportion of Granzyme B+perforin+ cells among CD8+ T cells and PD-1+CD8+ T cells, before and after treatment, among LR (n = 7) and EP (n = 8). Gating strategy of CD8+ T cells is shown in Extended Data Fig. 5c. *P < 0.05, **P < 0.01, ***P < 0.005, ****P < 0.001, according to a Wilcoxon signed-rank test for paired groups and two-tailed Mann–Whitney U-test for unpaired groups. Data are presented as mean ± s.d. In each box plot, the box represents the interquartile range, and whiskers represent minima and maxima. RCC, renal cell carcinoma.

