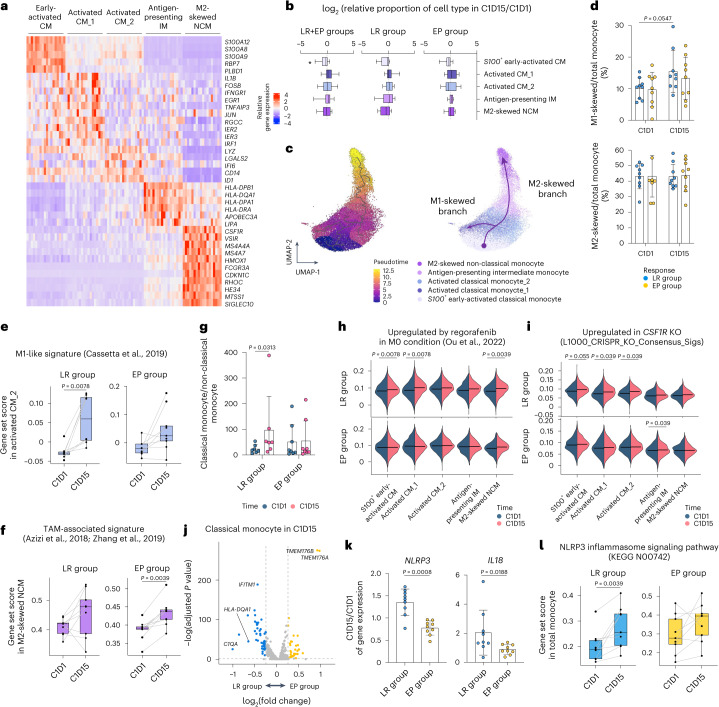
Fig. 4. Dynamic monocyte response.
a, Heat map of cluster-specific DEGs of monocyte clusters. b, Fold changes in the proportions of monocyte subclusters among myeloid cells among long-term responders (LR; n = 9), early progressors (EP; n = 9) and both (n = 18). c, UMAP and pseudotime trajectory initiated from early-activated classical monocytes toward either M1-skewed or M2-skewed route. d, The proportions of M1-skewed or M2-skewed monocytes among total monocytes among LR (n = 9) and EP (n = 9). e, Module scores for an M1-like gene set within the activated classical monocyte_2 subset in LR (n = 8) and EP (n = 9). f, Module scores for a gene set related to TAM among M2-skewed non-classical monocytes in LR (n = 9) and EP (n = 9). g, Ratio of classical to non-classical monocytes among LR (n = 7) and EP (n = 8). h, Module scores for the gene set upregulated by regorafenib in each monocyte cluster from LR (n = 9) and EP (n = 9). i, Module scores for the gene set upregulated in CSF1R_Up_from_L1000_CRISPR_KO_Consensus_Sigs in each monocyte cluster from LR (n = 9) and EP (n = 9). j, DEGs among total monocytes on C1D15 in LR (n = 9) versus EP (n = 10). Blue and yellow indicate genes significantly upregulated in LR and EP, respectively. k, Changes in the expression of NLRP3 and IL18 in LR (n = 9) and EP (n = 9). l, Module score for the NLRP3 inflammasome signaling pathway-related gene set in total monocytes of LR (n = 9) and EP (n = 9). Gating strategy of monocytes is shown in Extended Data Fig. 6b. *P < 0.05, according to a Wilcoxon signed-rank test for paired groups and two-tailed Mann–Whitney U-test for unpaired groups. Data are presented as mean ± s.d. In each box plot, the box represents the interquartile range, and whiskers represent minima and maxima. CM, classical monocyte; IM, indeterminate monocyte; KO, knockout; NCM, non-classical monocyte.

