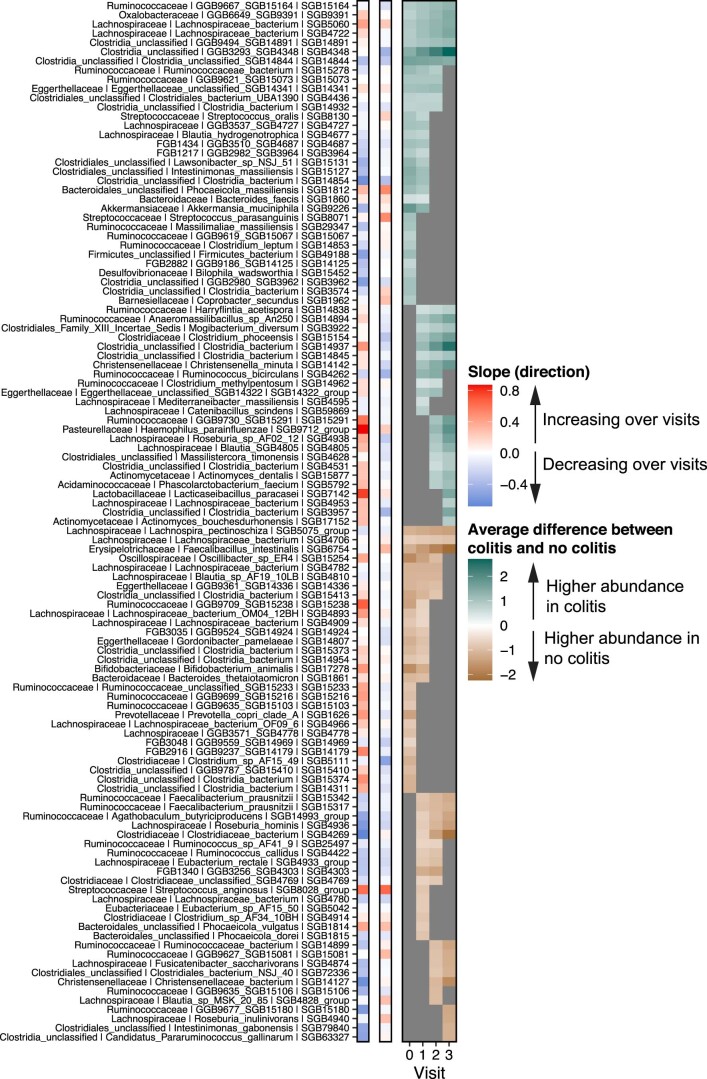
Extended Data Fig. 10. Patients who developed and not developed colitis.
The figure shows, for each microbial SGB listed, its slopes in patients who developed and not developed colitis, respectively, regardless of response to therapy. Red and blue colors indicate whether the focal SGB is increasing or decreasing in its abundance over study visits, respectively. It then shows the average difference between patients with and without colitis across the different study visits. Non-gray cells in the heatmap correspond to the focal SGB’s log-fold change in abundance between patients with and without colitis, respectively. Teal cells correspond to study visits for which the abundance of the focal SGB is higher in in patients who developed colitis compared to those resistant to colitis, and vice versa for brown cells (at 90% BCL). Gray cells denote differences between patients with and without colitis whose 90% CI overlapped with zero.

