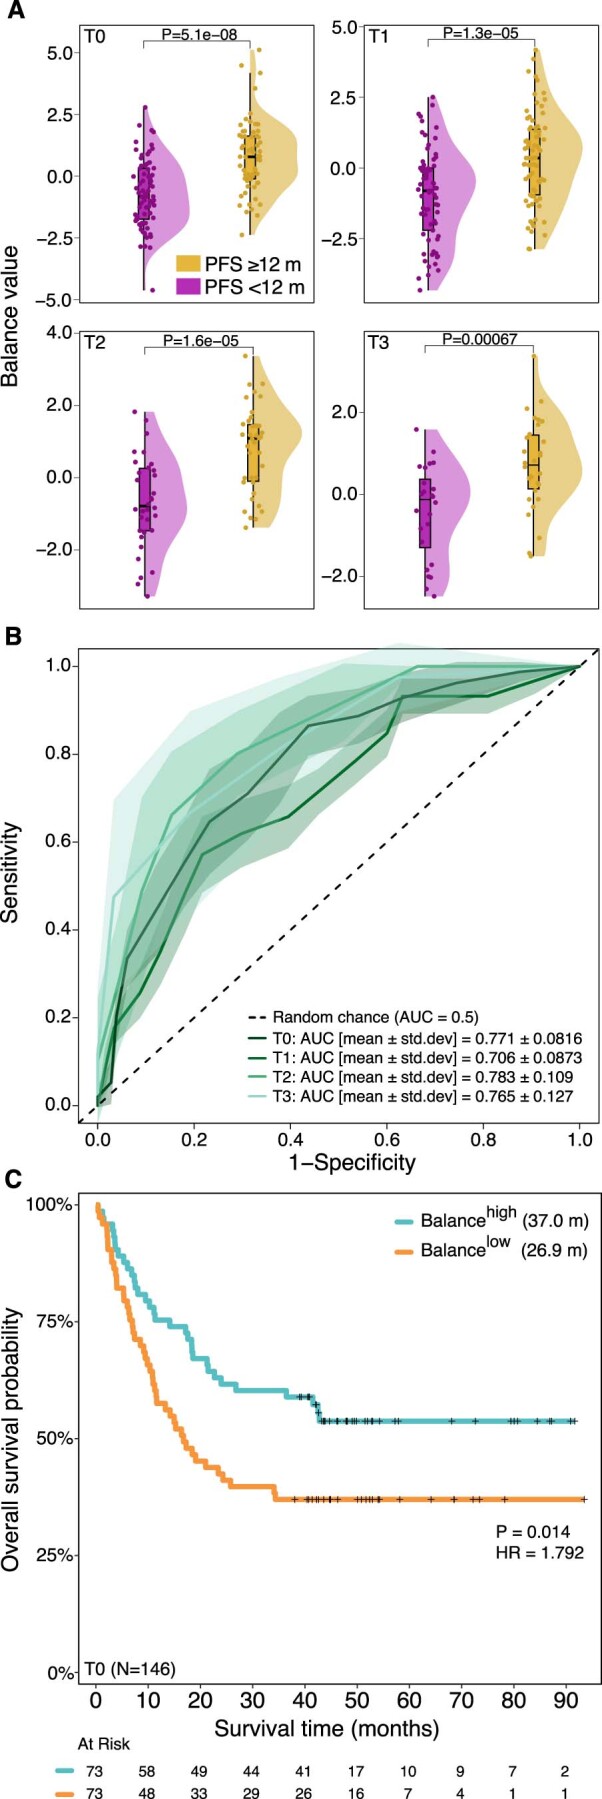
Extended Data Fig. 3. Extended longitudinal balance.

The extended balance has 12 SGBs in the numerator (A. butyriciproducens [SGB14993 group], I. bartlettii [SGB6140], D. sp AF24 7LB [SGB4571], L. gasseri [SGB7038 group], L. celerecrescens [SGB4868], R. sp NSJ 71 [SGB4290], GGB9640 [SGB15115], E. rectale [SGB4933 group], E. entriosum [SGB5045], E. sp AM28 29 [SGB6796 group], Clostridium sp AF15 49 [SGB5111], and A. bouchesdurhonensis [SGB17152]) and 9 SGBs in the denominator (R. lactatiformans [SGB15271], R. unclassified [SGB15265 group], P. copri clade A [SGB1626], GGB1420 [SGB1957], Gemmiger [SGB15299], B. obeum [SGB4809], Clostridiales unclassified [SGB15145], P. vulgatus [SGB1814], and B. clarus [SGB1832]). Panel (A) balance’s ability to discriminate between patients with PFS ≥ 12 (n = 83; n0 = 62; n1 = 77; n2 = 38; n3 = 30) and PFS < 12 (n = 92; n0 = 74; n1 = 69; n2 = 34; n3 = 24) months across study visits. Boxplots represent minima, Q1, Q2, Q3, and maxima. Panel (B) the balance’s predictive ability expressed as the Area Under the Curve (AUC) computed from 100 times repeated five-fold cross-validation (CV). Each line shows, for each study visit, the average across the 100 repeated five-fold CVs with the shaded area representing the 95% confidence interval. Panel (C) Kaplan–Meier curves and multivariable Cox regression analysis of overall survival in 146 patients at baseline (one patient was removed due to missingness in the included predictor variables) according to high (above median) and low (below median) values of the balance after adjusting for age, sex, BMI, previous therapy, PPI and antibiotic use.
