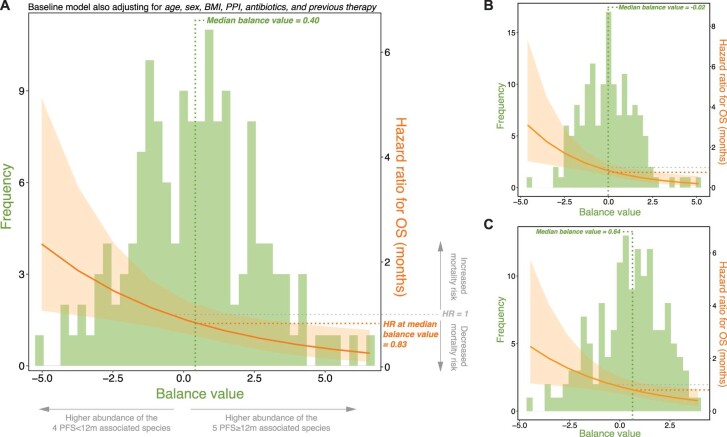
Extended Data Fig. 4. Treating balances as continuous independent variables.
Panel A-C shows a multivariable Cox regression analysis of overall survival (OS) in months for 146 patients at baseline (one patient was removed due to missingness in the included predictor variables) treating (a) the first balance (Fig. 2a), (b) the second balance (that is, the extended longitudinal balance), and (c) the third balance (that is, the ‘baseline only’ balance) as a continuous independent variable. While the histograms show the distribution of each balance (right y-axes), each regression line represent the hazard ratio as a smooth function of each balance (left y-axes). All models are adjusted for age, sex, BMI, PPI and antibiotics use, and previous therapy.

