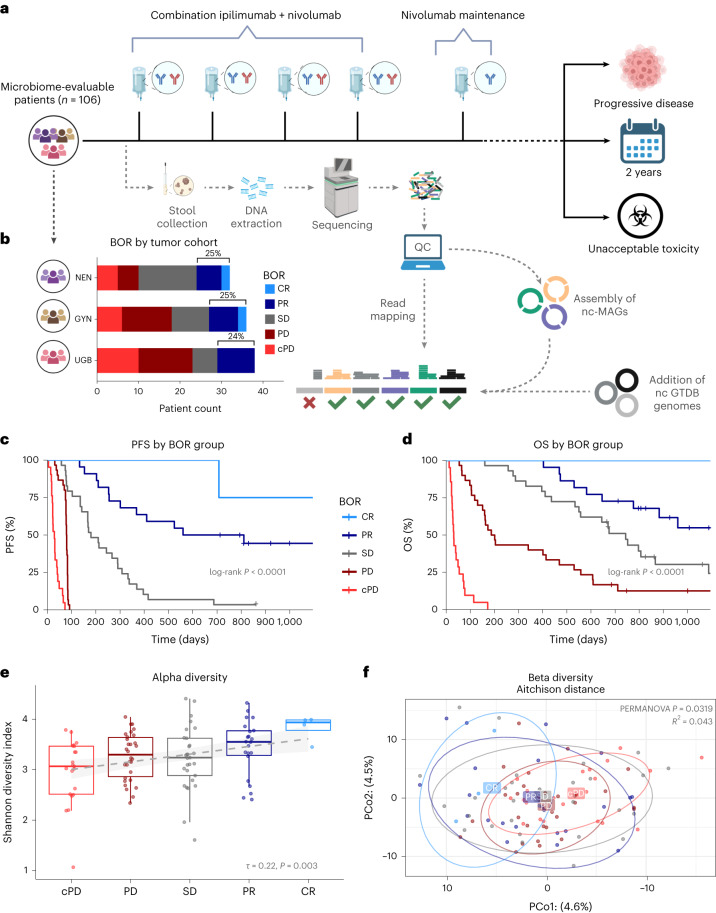
Fig. 1. Clinical and gut microbiome compositional differences between responders and nonresponders.
a, CA209-538 study and microbiome analysis schema (created using BioRender.com). Pretreatment fecal samples were collected from n = 106 trial participants and subjected to DNA extraction, shotgun metagenomic sequencing, and analysis using a genome-resolved metagenomics pipeline, involving quality control (QC), de novo assembly of near-complete MAGs (nc-MAGs) and precise read mapping. Further to the standard filters, reads mapping to genomes with <50% coverage breadth were removed. b, Bar plot of patient RECIST 1.1 BOR by histology cohort for microbiome-evaluable patients. The percentages of patients with an objective response (PR or CR) are indicated. c, Kaplan–Meier curve of PFS stratified by BOR category (cPD n = 21, PD n = 30, SD n = 29, PR n = 22, CR n = 4). Log-rank test P = 2.1 × 10−42. d, Kaplan–Meier curve of OS stratified by BOR category (cPD n = 21, PD n = 30, SD n = 29, PR n = 22, CR n = 4). Log-rank test P = 1.2 × 10⁻³⁴. e, Boxplots of microbiome alpha diversity, as measured by the Shannon diversity index, across BOR categories (cPD n = 21, PD n = 30, SD n = 29, PR n = 22, CR n = 4). Boxplot center line indicates the median; box limits indicate the upper and lower quartiles; and whiskers indicate 1.5× the interquartile range. The linear model (line of best fit) for the Shannon diversity index and BOR (with shaded 95% confidence interval) is superimposed (in gray). Kendall τ and P values for the association between the Shannon diversity index and BOR are indicated. f, Principal coordinate 1 (PCo1) versus 2 (PCo2) using the Aitchison distance of strain abundances, colored by patient BOR category. Ellipses depict 0.8 of each group’s multivariate t distribution. PERMANOVA P value and R2 using 9,999 permutations are indicated.

