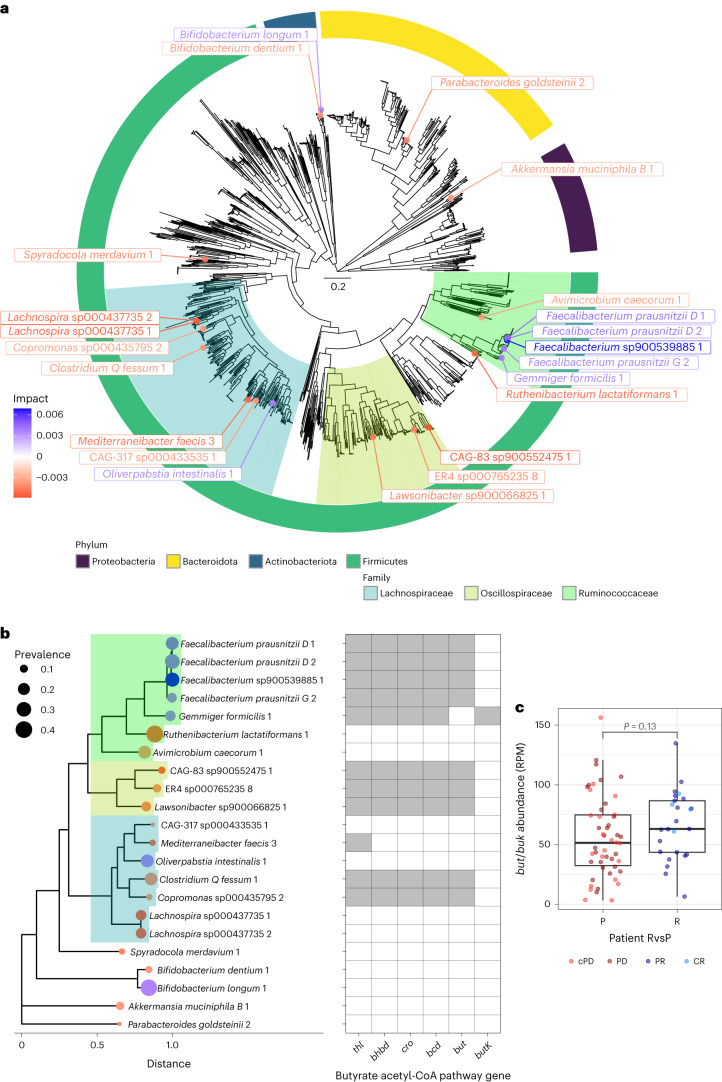
Fig. 3. Firmicutes bacteria dominate the gut microbiome strain–response signature.
a, Phylogenetic tree of bacterial strains in our custom reference library (n = 1,391 strains, excluding n = 6 archaea), highlighting the top 22 strains (labels are colored by impact (that is, feature importance) on RvsP predictions). Four main phyla are shown by the colored ring, with the Ruminococcaceae, Oscillospiraceae and Lachnospiraceae families highlighted. The scale for phylogenetic distance is shown in the center of the tree. b, Phylogenetic tree of the top 22 strains, with the tips colored by strain impact and sized by strain prevalence. The adjacent heat map depicts the presence or absence of genes within the primary butyrate-producing (acetyl-CoA) pathway. Full enzyme (encoding gene) names: acetyl-CoA acetyltransferase (thl), β-hydroxybutyryl-CoA dehydrogenase (bhbd), crotonase (cro), butyryl-CoA dehydrogenase (bcd), and the alternative terminal enzymes butyryl-CoA:acetate CoA transferase (but) and butyrate kinase (buk). c, Boxplots of the sample-wise abundance of butyrate acetyl-CoA terminal enzymes (but + buk), split by patient response (progression (P) n = 51, response (R) n = 26). Boxplot center line indicates the median; box limits indicate the upper and lower quartiles; and whiskers indicate 1.5× the interquartile range. Abundance is normalized as reads per million (RPM). P value by the Mann–Whitney U test is indicated.

