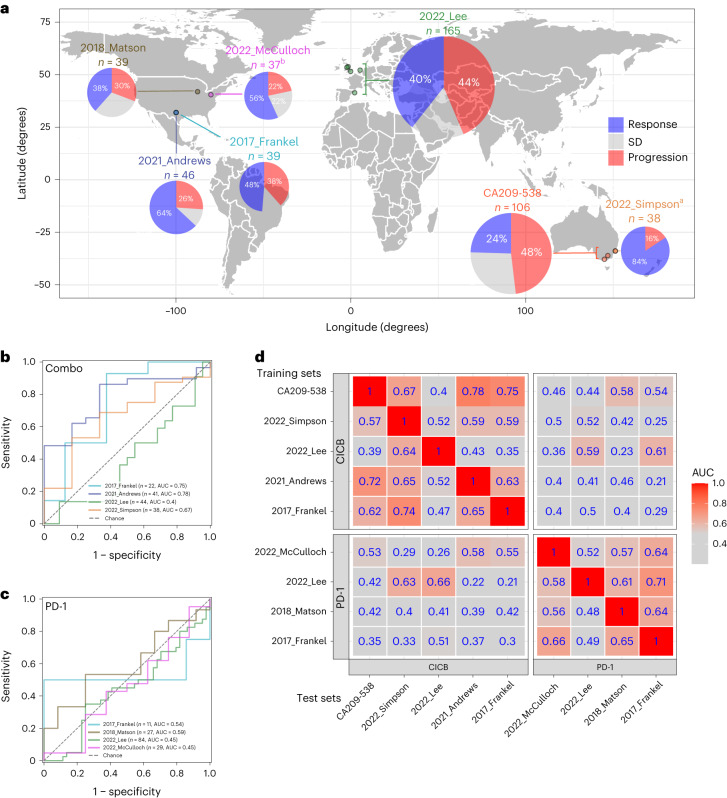
Fig. 4. Meta-analysis reveals that gut microbiome strain–response signatures are ICB regimen specific.
a, World map showing the studies included in our meta-analysis. Bordered circles depict the coordinates of recruiting sites (cities). Pie charts depict the proportion of patients with tumor response, progression or SD. The area of the pie charts depicts the sample size. a2022_Simpson studied neoadjuvant ipilimumab + nivolumab for stage III melanoma and thus used pathological response criteria (International Neoadjuvant Melanoma Consortium criteria); all other studies used the RECIST 1.1 criteria. bFor this study, only the subset of patients (n = 37) with stool collected within 15 days of the start of ICB therapy was included in the meta-analysis. b, ROC curve of strain–RvsP classifiers trained on the discovery cohort (CA209-538) and tested on external CICB cohorts separately. c, ROC curve of strain–RvsP classifiers trained on the discovery cohort (CA209-538) and tested on external anti-PD-1 monotherapy cohorts separately. d, Heat map denoting the AUC scores for strain–RvsP classifiers trained on one dataset (column) and tested on another (rows). Panels are faceted by ICB regimen (CICB or anti-PD-1 monotherapy).

