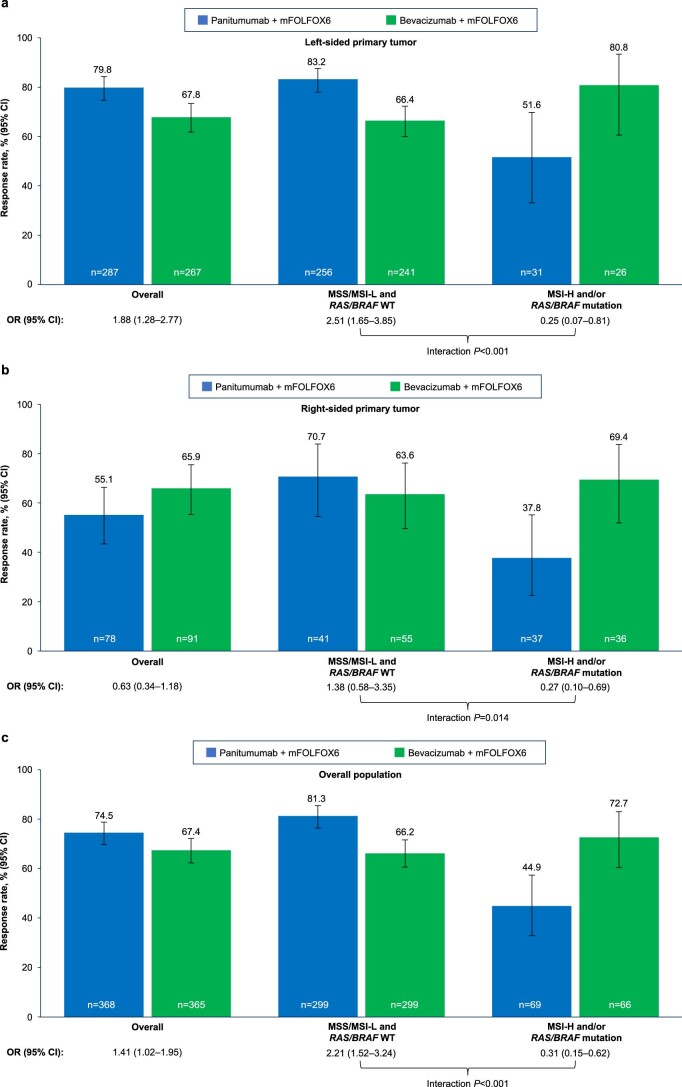
Extended Data Fig. 6. Response rates by RAS/BRAF and MSS status.
Response rates in (a) patients with left-sided primary tumors, (b) patients with right-sided primary tumors and (c) the overall population (all ctDNA-evaluable patients). Data plotted are percentages of patients with a response ± 95% CIs. ORs were calculated by logistic regression analysis. Statistical tests were two-sided without adjustment for multiple comparisons. mFOLFOX6, modified FOLFOX6; MSI-H, microsatellite instability–high; MSI-L, microsatellite instability–low; MSS, microsatellite stable; OR, odds ratio; WT, wild type.

