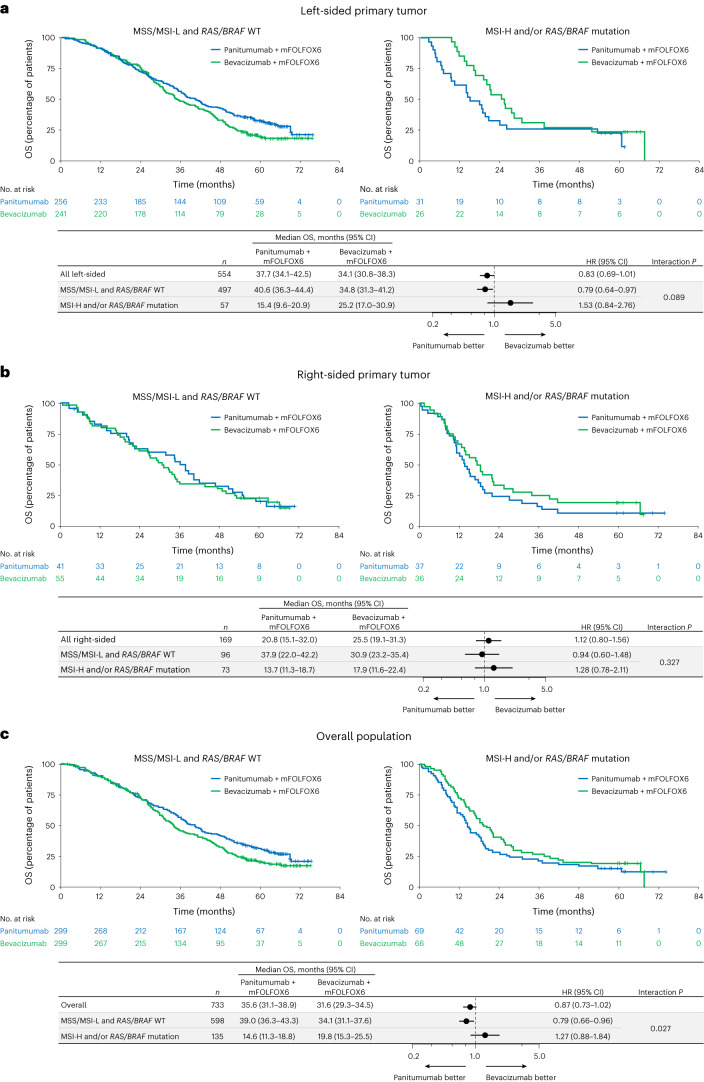
Fig. 5. Overall survival by RAS/BRAF and MSS status.
a–c, Kaplan–Meier estimates of OS in patients with left-sided primary tumors (a), patients with right-sided primary tumors (b) and the overall population (all ctDNA-evaluable patients) (c). The forest plots below each Kaplan–Meier plot show HR ± 95% CI. A Cox proportional hazard model without stratification factors was used to calculate HRs for group comparisons and P values for the interaction between negative hyperselection status and treatment group. Statistical tests were two-sided without adjustment for multiple comparisons.

