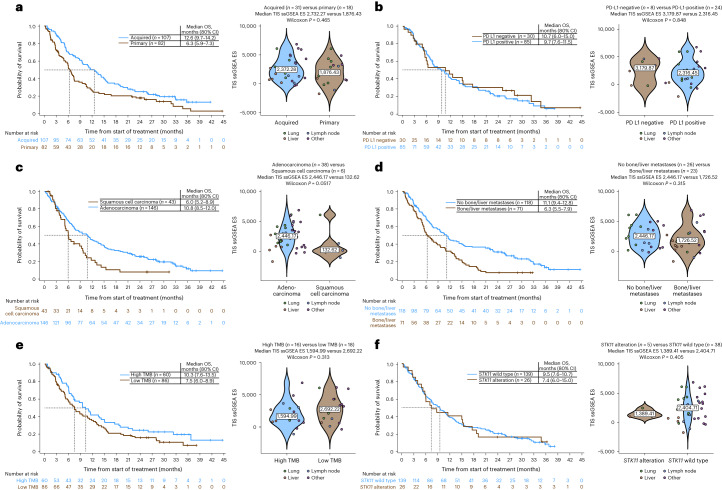
Fig. 3. OS and gene expression profiling in subgroups known to be associated with poor immunotherapy response among patients who received durvalumab plus olaparib, danvatirsen or oleclumab.
a–f, Kaplan–Meier distributions of OS (left) and TIS ssGSEA enrichment score (ES) distributions (violin plots, right) comparing patients with primary or acquired resistance (a), PD-L1-negative or PD-L1-positive status (b), squamous cell carcinoma or adenocarcinoma histology (c), with or without bone/liver metastases (d), high or low TMB (e) and STK11-altered or STK11-wild-type tumors (f). Median OS, 80% CIs and numbers of patients at risk are shown in each Kaplan–Meier plot. Violin plots show data from individual patients (dots), color-coded by site of sample, the median value (text box) and the probability density distribution smoothed using a kernel density estimator (shaded areas). ssGSEA ES distributions were compared using two-sided Wilcoxon rank-sum tests, with no correction for multiplicity of testing; associated P values and the number of tumor samples in each group are reported for each comparison.

