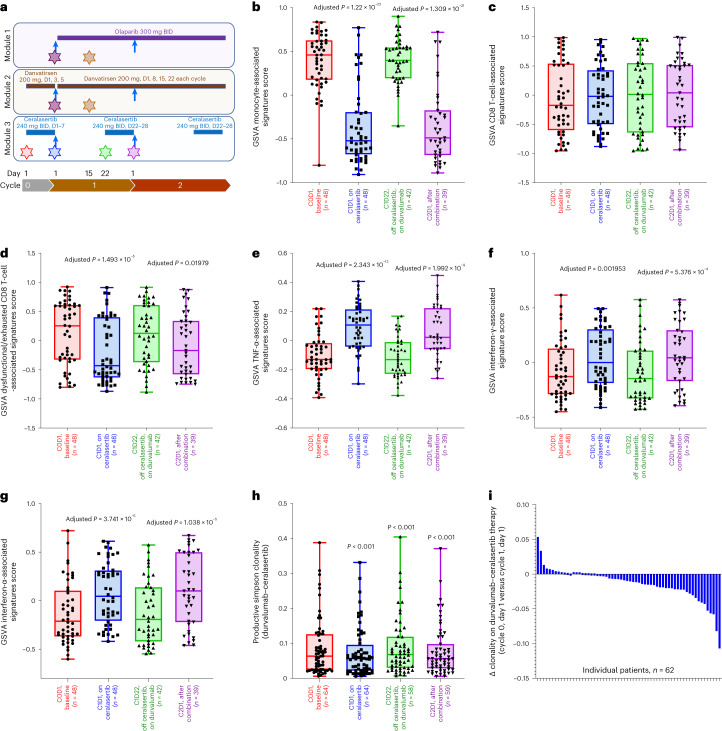
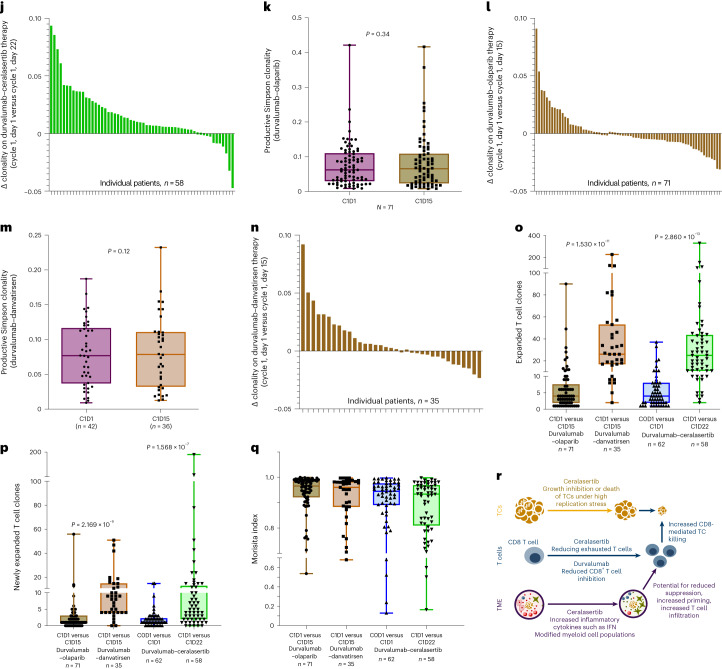
Fig. 5. Ceralasertib induces systemic immunomodulation that enhances the immune-mediated effects of durvalumab in patients with NSCLC with progression on prior anti-PD-(L)1 treatment.
a, Schema depicting treatment schedule for modules 1 (durvalumab–olaparib), 2 (durvalumab–danvatirsen) and 3 (durvalumab–ceralasertib), showing durvalumab administration (blue arrows), combination agent dosing (continuous colored bars), and pretreatment/on-treatment blood sample collection time points (stars). BID, twice daily. b–g, Effects of ceralasertib and durvalumab treatment on longitudinal blood-derived transcriptomes are depicted in the box plots showing differentially expressed monocyte-associated signatures (b), CD8 T-cell-associated signatures (c), dysfunctional/exhausted CD8 T-cell-associated signatures (d), TNF-α-associated signatures (e), interferon-γ-associated signatures (f) and interferon-α-associated signatures (g). P values are for comparisons with respective cycle 0, day (D) 1 time points. P values for visit dates represent linear mixed model effects, illustrating changes in on-treatment samples. h–q, Effects of ceralasertib, olaparib and danvatirsen with durvalumab on longitudinal blood-derived T cell repertoire: box plots showing productive Simpson T cell clonality with durvalumab–ceralasertib (h); waterfall plots showing changes in clonality on treatment by patient with durvalumab–ceralasertib on cycle 0, day 1 versus cycle 1, day 1 (i) and cycle 1, day 1 versus cycle 1, day 22 (j); box plots showing distributions of T cell clonality with durvalumab–olaparib (k), and waterfall plots showing changes in clonality on treatment by patient with durvalumab–olaparib on cycle 1, day 1 versus cycle 1, day 15 (l); box plots showing distributions of T cell clonality with durvalumab–danvatirsen (m), and waterfall plots showing changes in clonality on treatment per patient with durvalumab–danvatirsen on cycle 1, day 1 versus cycle 1, day 15 (n); box plots of expanded T cell clones (o), newly detected expanded T cell clones (p) and Morisita index for durvalumab plus olaparib, danvatirsen or ceralasertib at indicated visit dates (q). P values for visit dates represent two-sided Wilcoxon paired signed-rank tests between time points or two-sided Wilcoxon signed-rank tests between study modules, with correction for multiplicity of testing (Benjamini–Hochberg procedure), illustrating changes in on-treatment samples. r, Proposed immunomodulatory mechanism of action effects of ceralasertib with durvalumab in the periphery and tumor. For all box plots (b–h, k, m and o–q), box centerlines show medians, box limits show upper and lower quartiles, and whiskers show range.


