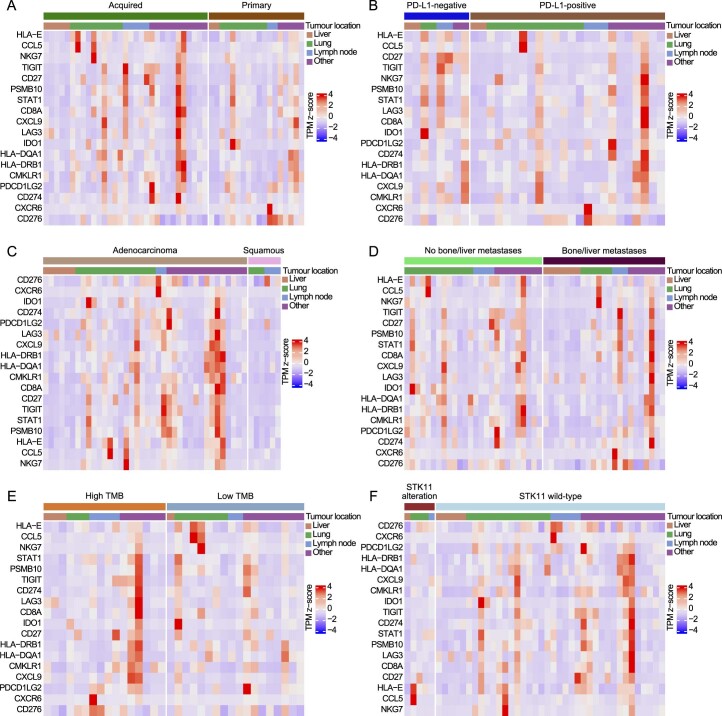
Extended Data Fig. 2. Gene expression profiling in subgroups with known association with poor immunotherapy response among patients who received durvalumab plus olaparib, danvatirsen or oleclumab.
Gene-wise transcript-per-million (TPM) z-score heatmaps for the 18 genes comprising the tumour inflammation signature (TIS) in tumour samples from patients with a, primary or acquired resistance to prior immune checkpoint blockade therapy (n = 18, n = 31; overall prevalence: n = 81 [43.1%], n = 107 [56.9%]), b, PD-L1-positive or PD-L1-negative tumours (n = 16, n = 18; overall prevalence: n = 73 [58.9%], n = 51 [41.1%]), c, adenocarcinoma or squamous cell histology (n = 38, n = 6; overall prevalence: n = 130 [75.1%], n = 43 [24.9%]), d, with or without bone/liver metastases (n = 23, n = 26; overall prevalence: n = 76 [40.4%], n = 112 [59.6%]), e, high or low TMB (n = 16, n = 18; overall prevalence: n = 60 [41.1%], n = 86 [58.9%]) and f, STK11-altered or STK11-wild-type tumours (n = 5, n = 38; overall prevalence: n = 26 [14.9%], n = 148 [85.1%]). Tumour location and histology are annotated.

