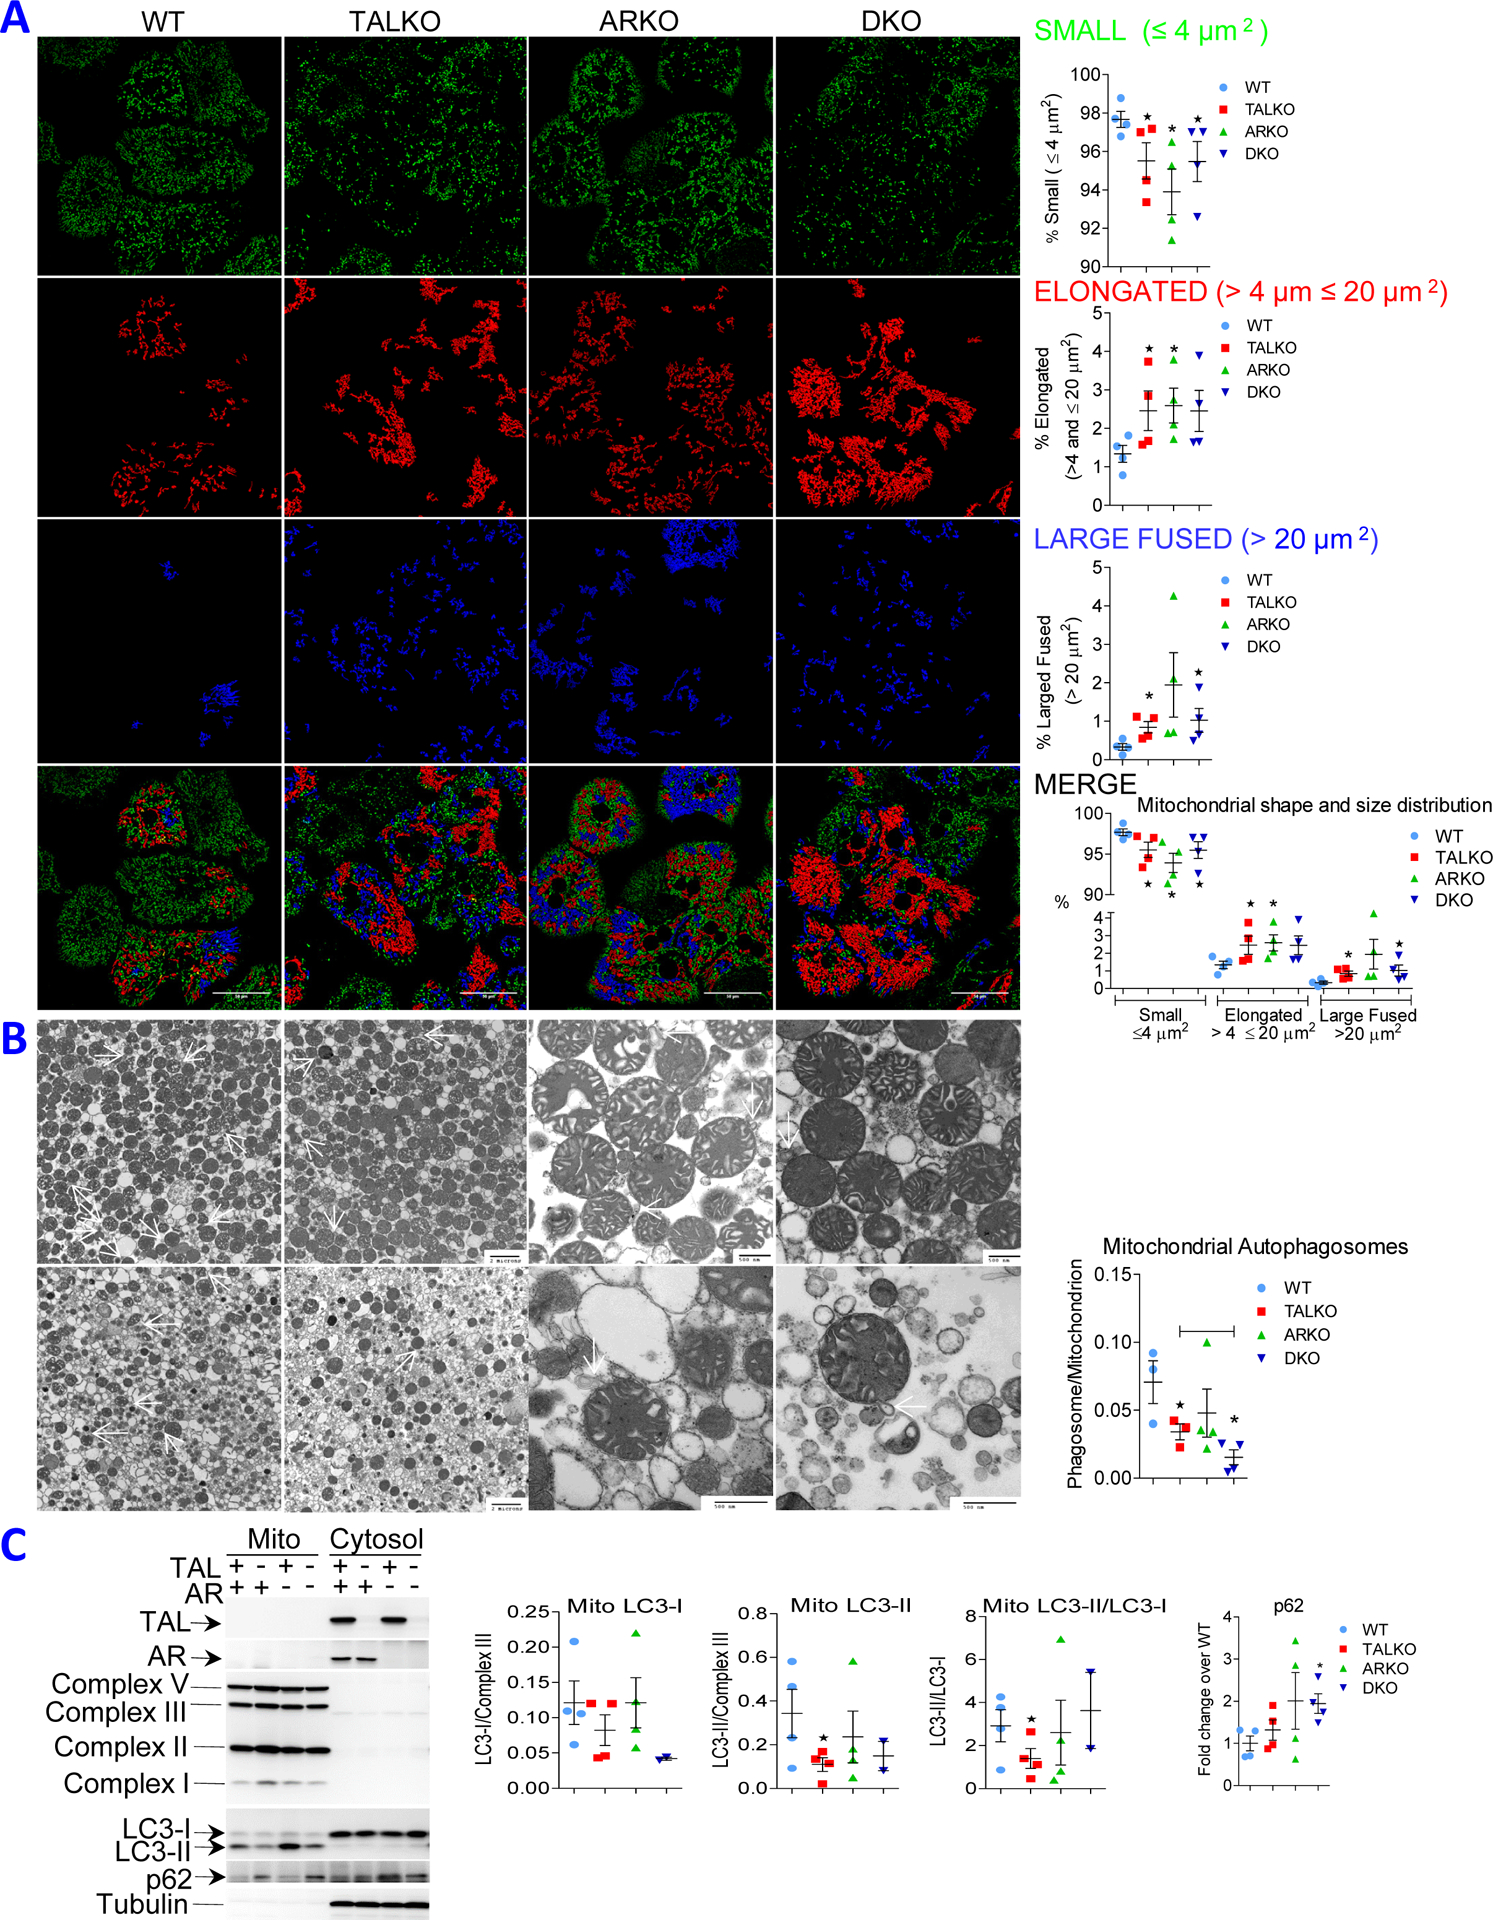
Figure 3. Regulation of mitochondrial homeostasis by the TAL-AR axis.

A, Immunofluorescence microscopy of mitochondria. Left panel, representative images colored by size and shape. Right panel, cumulative analyses represent mean ± SEM of 5 mice per genotype. *, p < 0.05 relative to WT. B, Electron microscopy of liver mitochondria. Left panel, formation of autophagosomes from mitochondrial membranes, also termed phagophores (autophagosomes/mitochondrion), are indicated by white arrows. Right panel, cumulative analysis of mitochondrial autophagosome formation. C, Western blot analysis of LC3-I and LC3-II isoforms and mTOR in purified mitochondrial and cytosol fractions of liver from WT, TALKO, ARKO, and DKO mice. Left panel, representative blots. Right panel, cumulative analysis of LC3-I, LC3-II, LC3-II/LC3-I, and p-mTORS2448 in 4–5 mice per genotype. *, p < 0.05 relative to WT.
