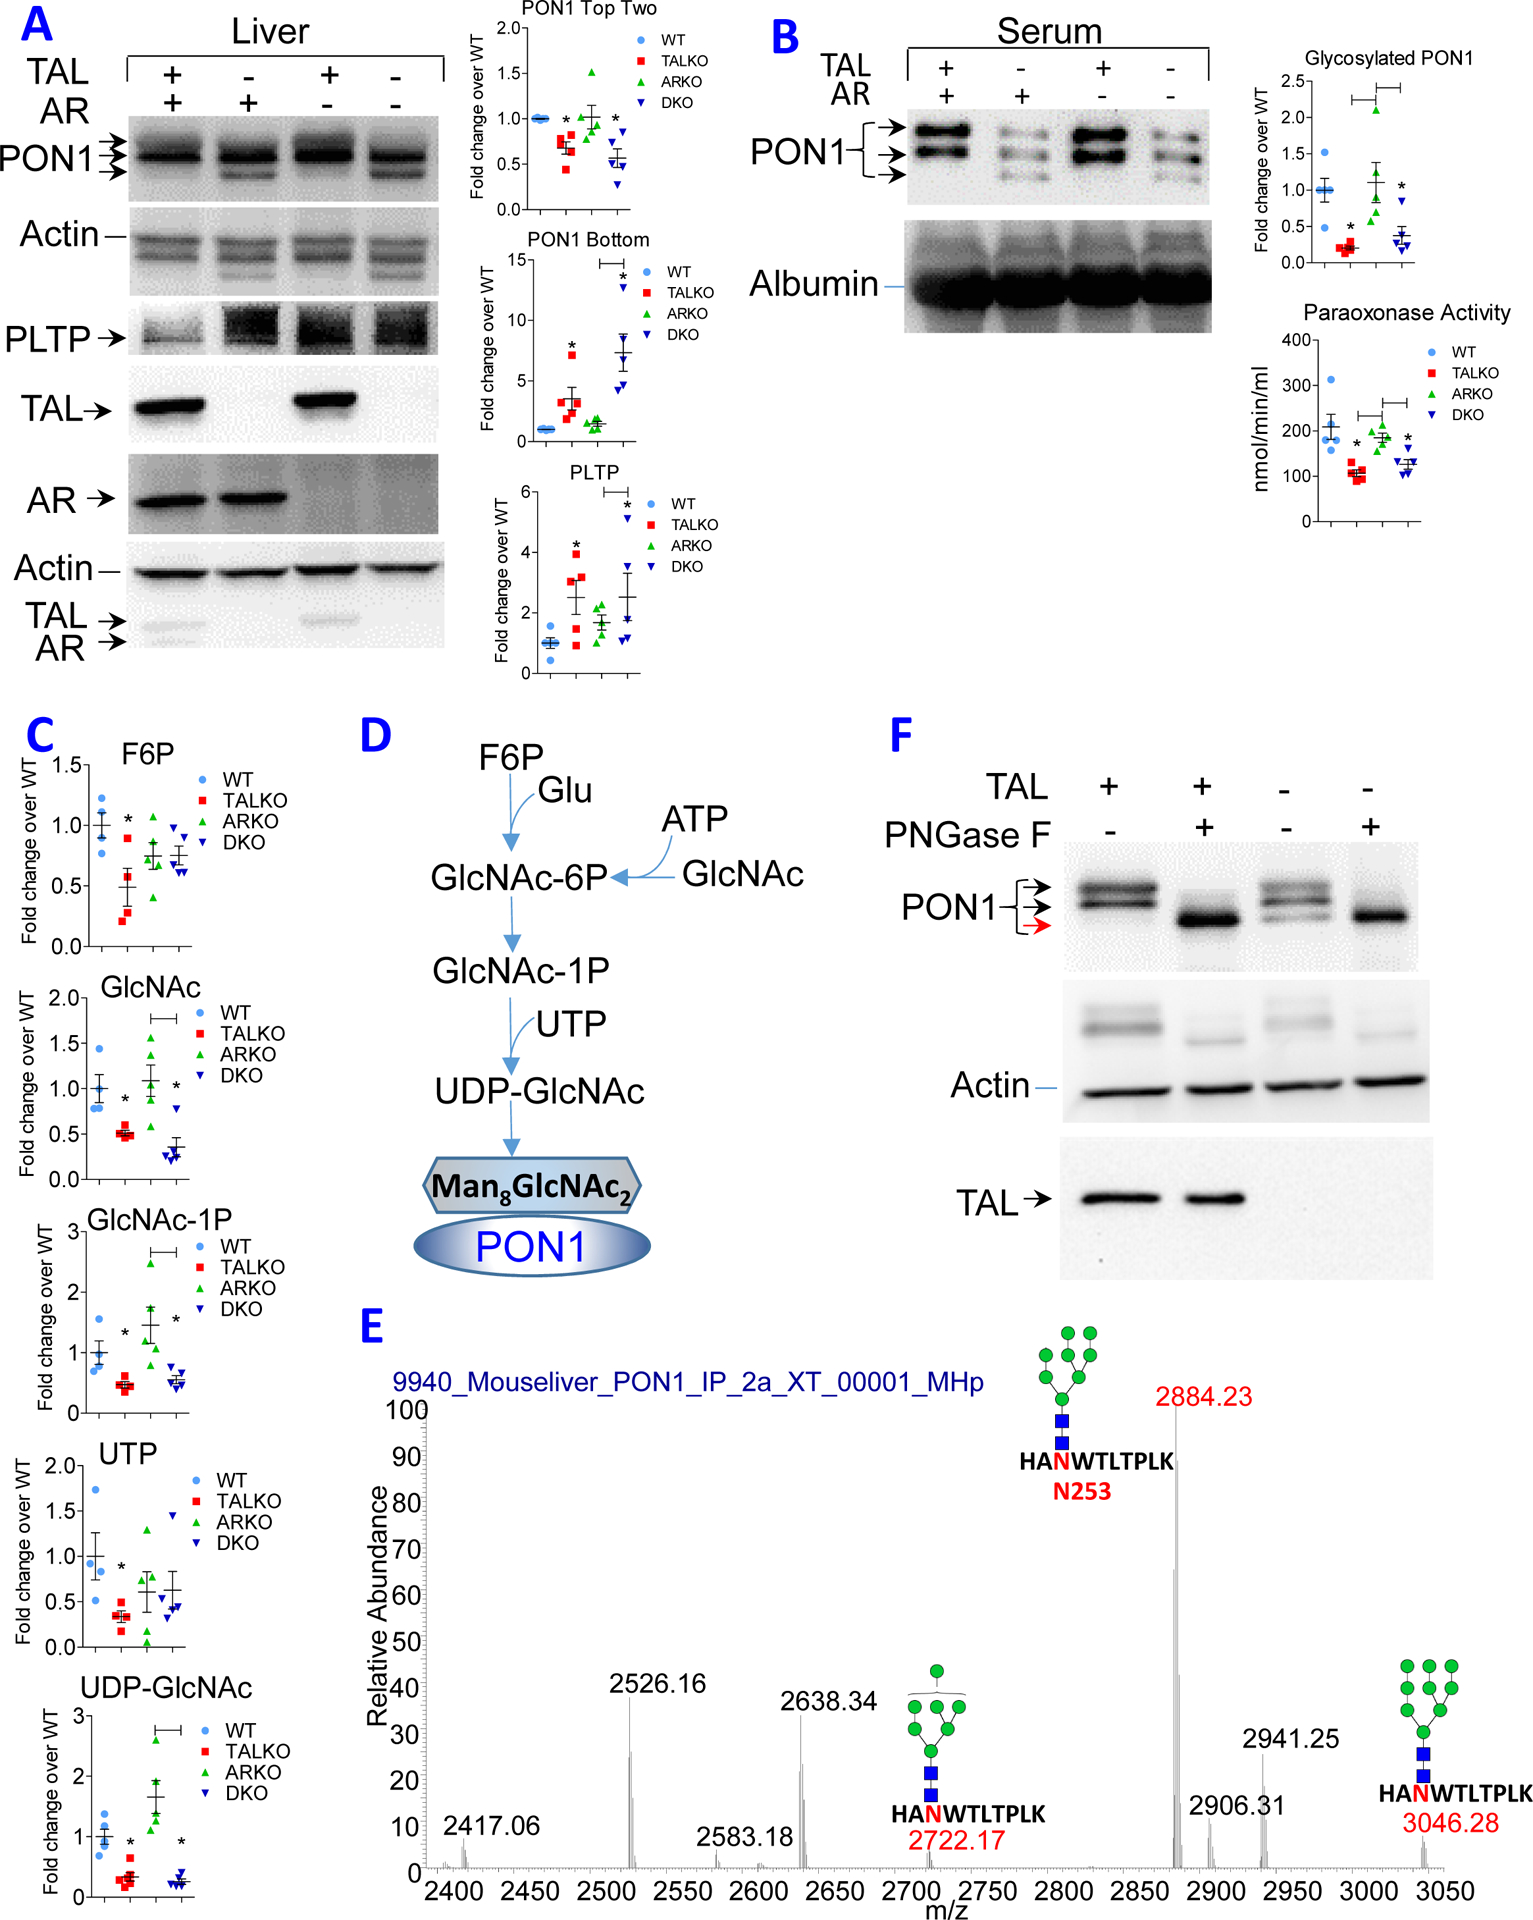
Figure 4. Diminished glycosylation of PON1 in TAL deficiency.

A, Western blot analysis of PON1 and PLTP expression in liver of WT, TALKO, ARKO, and DKO mice using five animals per genotype. Left panel, representative western blots. Each lysate was validated by expression of TAL and AR, using β-actin as loading control. Right panel, Bar charts show expression of top two isoforms and lowest molecular weight isoform of PON1 and PLTP relative to β-actin. *, p < 0.05 relative to WT. B, Western blot analysis of PON1 expression and paraoxonase activity in the serum of WT, TALKO, ARKO, and DKO mice. C, Detection of glycosylation substrates in the liver of WT, TALKO, ARKO, and DKO mice. *, p < 0.05 relative to WT; differences at p < 0.05 between other mouse strains are indicated by brackets. D, Schematic diagram of UDP- GlcNAc biosynthesis required for glycosylation of PON1. E, Mapping of N-glycosylation at position N253 in PON1 peptide “HANWTLTPLK” in WT liver extracts. High-energy collisional dissociation tandem mass spectroscopy (HCD-MS2) predominantly detected Man8GlcNAc2 with lesser amounts of Man9 and Man7 N-glycans. F, Treatment of hepatocyte lysates in vitro with peptide-N-glycosidase F, PNGase F. Western blot represents five experiments. Black arrows indicate glycosylated isoforms, while red arrow indicates non-glycosylated isoform.
