Figure 2.
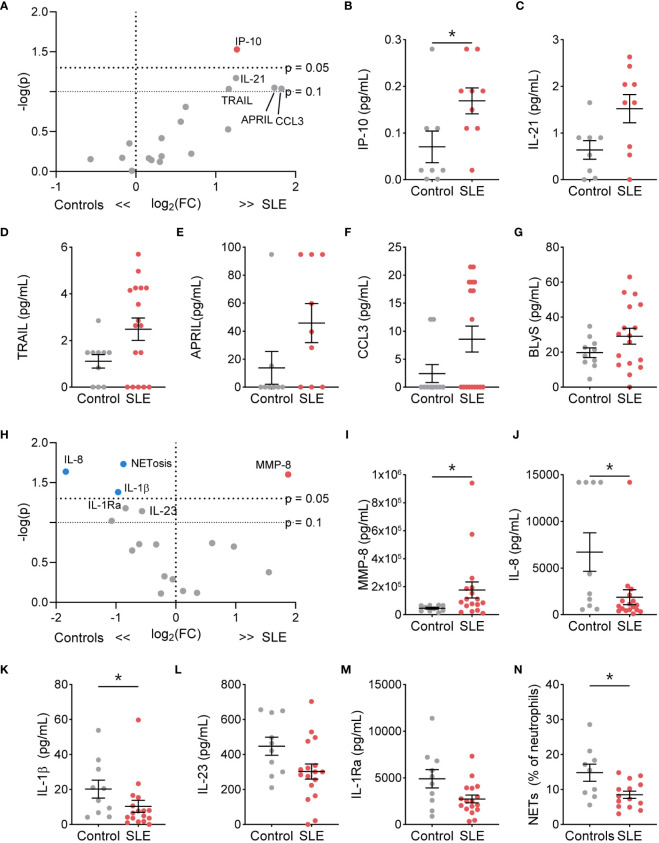
The functional phenotype of SLE traditional neutrophils differs under basal conditions and following stimulation compared to control traditional neutrophils. (A) Volcano plot of the difference between unstimulated functions in traditional neutrophils isolated from SLE patients and controls. Red dots indicate those significantly higher in neutrophils from SLE patients compared to those from controls. Levels of secreted (B) IP-10, (C) IL-21, (D) TRAIL, (E) APRIL, (F) CCL3, and (G) BLyS from unstimulated control or SLE traditional neutrophils as measured by flow cytometry. (H) Volcano plot of the difference between G-CSF+GM-CSF-stimulated functions in traditional neutrophils isolated from SLE patients and controls. Red dots indicate those significantly higher and blue dots indicate those significant lower in neutrophils from SLE patients compared to those from controls. Levels of secreted (I) MMP-8, (J) IL-8, (K) IL-1β, (L) IL-23, and (M) IL-1Ra from unstimulated control or SLE traditional neutrophils as measured by flow cytometry. (N) Percent of neutrophils with NETs was determined by microscopy following DNA and myeloperoxidase staining in G-CSF+GM-CSF-stimulated traditional neutrophils isolated from controls or SLE patients. Statistical significance was determined using a Mann-Whitney test. Lines represent mean+SEM. *p<0.05.

