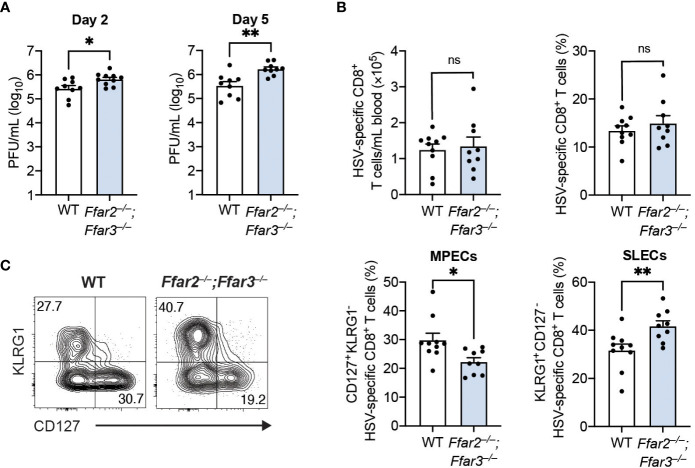
Figure 2.
Antigen load does not influence CD8+ T cell differentiation in Ffar2–/–;Ffar3–/– mice. Ffar2–/–;Ffar3–/– and WT mice were infected with 1 × 10⁶ PFU HSV-1 epicutaneously (A) or with 2 × 10⁵ PFU HSV-1 intravenously (B, C). (A) Flank skins were harvested on day 2 and day 5 post-infection for analysis of viral titres using PFU assays. (B, C) Analysis of endogenous gB498-505-specific CD8+ T cells was performed on blood 9 days post-infection. Absolute numbers and frequencies of gB498-505-specific CD8+ T cells (B) as well as MPEC and SLEC proportions (C) within total CD8+ T cells were measured. Data are presented as representative contour plots or bar graphs with mean + SEM of n = 9 – 10 mice per group from 2 independent experiments. Asterisks indicate statistically significant differences as analysed by Student’s t-tests (non-significant (ns) p ≥ 0.05, *p < 0.05, **p < 0.01).

