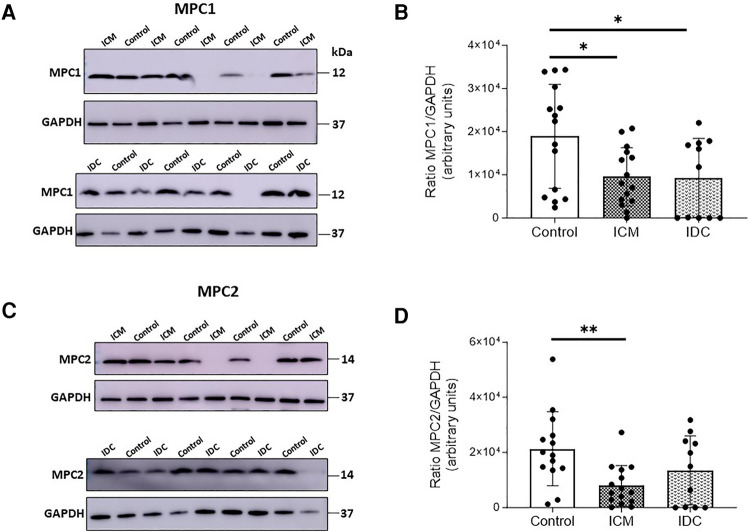
Figure 2.
Relative protein expression levels of MPC1 and MPC2 analyzed by WB. Representative images of WB and corresponding quantitative densitometry of MPC1 (A) or MPC2 protein expression (C) from cardiac tissue of control patients and patients with HFrEF of ischemic (ICM) or non-ischemic (idiopathic) origin (IDC). Corresponding quantitative densitometry of MPC1 (B) or MPC2 protein expression (D) Protein values were normalized using GAPDH. Points represent individuals (Control, n = 15; ICM, n = 15; IDC, n = 11), and mean ± standard deviation scatter cloud values are plotted. *p < 0.05; **p < 0.01.

