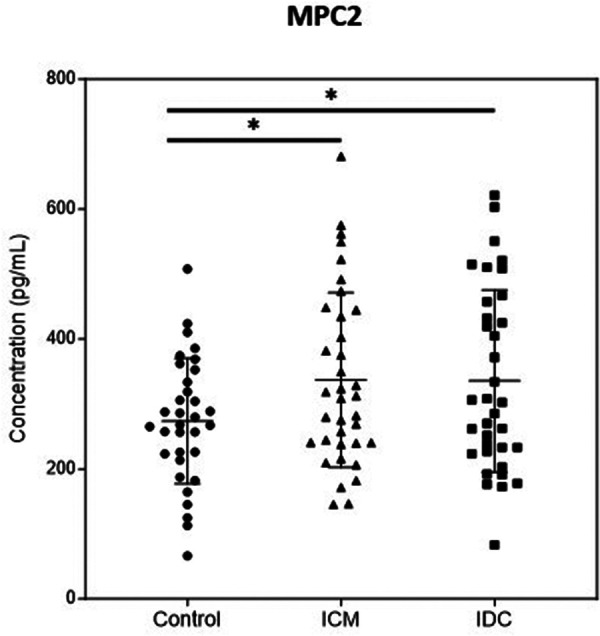
Figure 5.

Quantification of plasma MPC2 level in control group and patients with ischemic (ICM) or non-ischemic (IDC) HFrEF. The figure illustrates protein concentrations measured by ELISA. Points represent individuals (Control, n = 33; ICM, n = 36; IDC, n = 35) and mean ± standard deviation scatter cloud values are presented. *p < 0.05.
