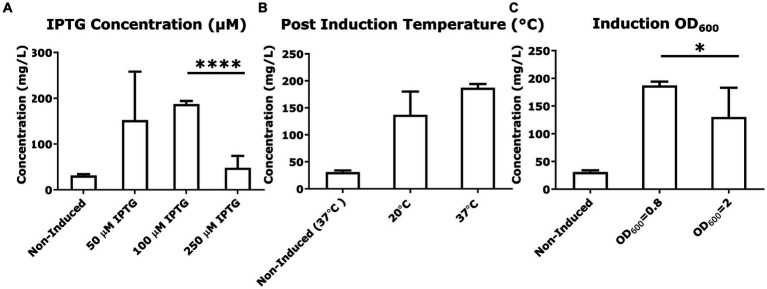
Figure 4.
Variation in culture conditions to optimize cGAMP productivity. (A–C) The concentration of cGAMP in the E. coli BL21(DE3) culture supernatants was measured using HPLC at 256 nm. The comparison of cGAMP concentrations among variations in culture conditions included IPTG concentrations used for induction, post-induction culture temperature, and cell number [the optical density (OD600) of culture] at induction. All cultures were grown in M9 minimal medium. * Bar plots show the average measurement done over three independent cultures (N = 3) and the error bars show the SEM. Statistical significance indicated by (*) was performed for dataset comparisons using unpaired, two-tailed t-test and Welch’s correction.

