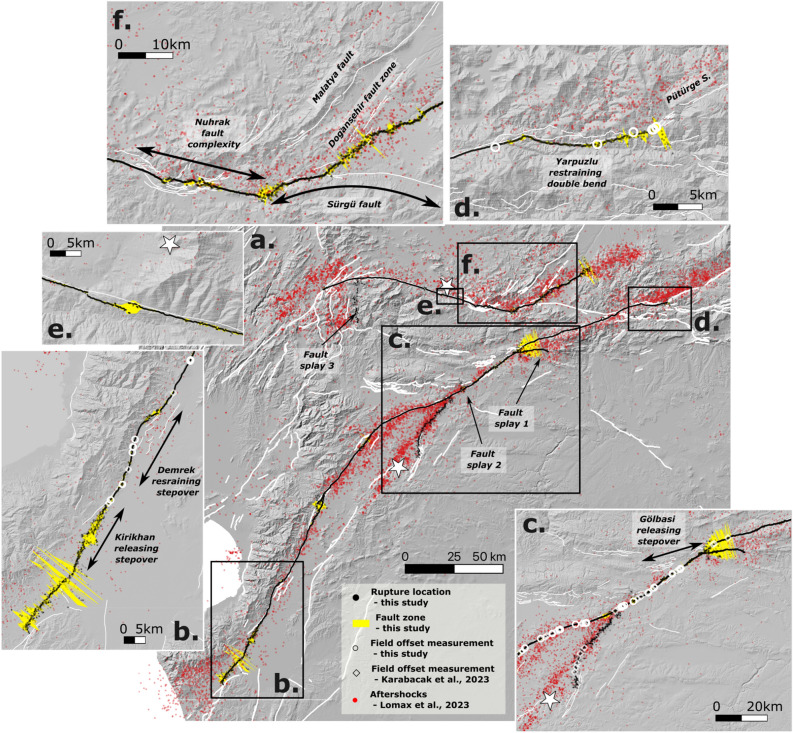
Figure 3.
Surface rupture triggered by the Kahramanmaraş 2023 doublet: (a) surface rupture for the Mw 7.6 and Mw 7.8 earthquakes (black dots) plotted together with the aftershock locations from31 (red dots). The epicenters of the main shocks relocated by31 are represented by white stars. White lines represent the database of active faults15 and the yellow area represents the total fault width derived from satellite image correlation (see “Methods” for details). (b–f) Zooms of several zones as well as the offsets measured in the field (white diamonds and circles): (b) shows a zoom of Narli and the EAF junction near the Mw 7. 8 epicenters; (c) shows a zoom on the previously unmapped fault trace; (d) shows a zoom on the previously unmapped fault trace to the west of the Golbasi releasing bend; (e) shows a zoom on the fault trace near the Mw 7.6 second main shock; (f) shows a zoom on the Demrek restraining bend. The background of the maps is the hillshade of the 2021 GLO30 Copernicus DEM at 30m spatial resolution, https://doi.org/10.5270/ESA-c5d3d65.

