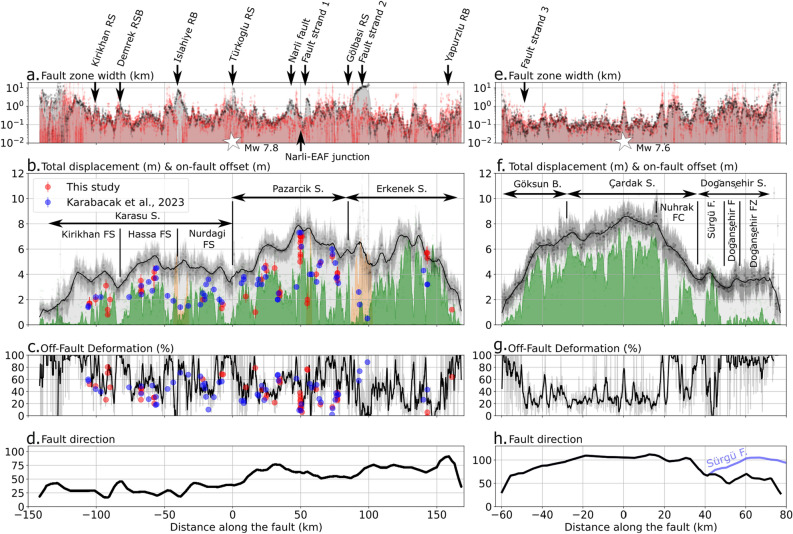
Figure 4.
Distribution of fault widths, offsets and diffuse deformation: (a,e) show the fault widths computed over 20 km long cross-profiles (black) and 5 km long cross-profiles (red) for the Mw7.8 rupture (left) and Mw7.6 ruptures (right). The location of fault splays and structural complexities are indicated by arrows, and the location of the epicenter is indicated by white stars. (b,f) The total offsets () computed on 20 km long profiles (black) using linear regression of far-field displacement and the on-fault offset () computed on 5 km long profiles (green) using the gradient criteria to determine the fault location (see Methods for details). The offsets measured in the field by this study and the one by6 are plotted as red and blue dots for the Mw 7.8 rupture (left). The segmentation of each rupture is also indicated. (c,g) The fault direction of the fault along the main ruptures. The fault direction of the Sürgü fault is also indicated in blue in (g).

