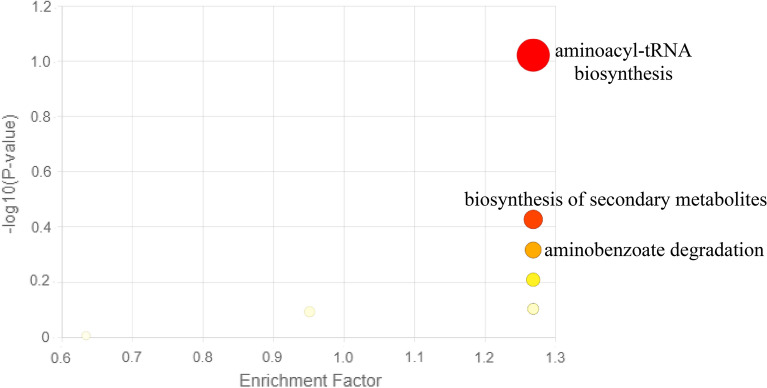
Figure 3.
Metabolic pathway analysis generated with the MetaboAnalyst based on the metabolites identified from B. subtilis, S. mycarofaciens, and B. licheniformis crude extracts. The pathway enrichment analysis was based on the p-values on the Y-axis to determine the significance of the metabolites. The range of colours on the plot, ranging from yellow to red, represents the varying levels of significance of the metabolites for the enrichment analysis.

