FIGURE 1.

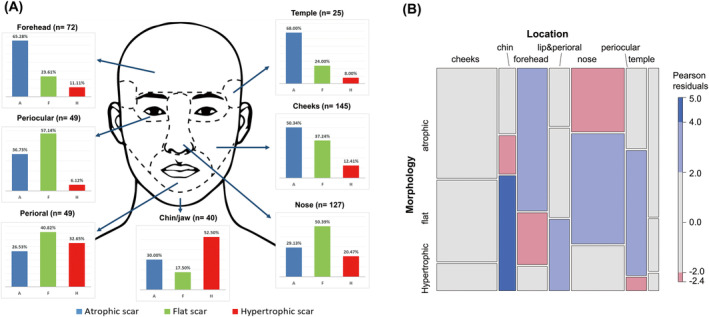
(A) Proportion of each scar type according to the location. (B) Mosaic plot comparing the distribution of scar morphology across locations.

(A) Proportion of each scar type according to the location. (B) Mosaic plot comparing the distribution of scar morphology across locations.