
FIGURE 2.
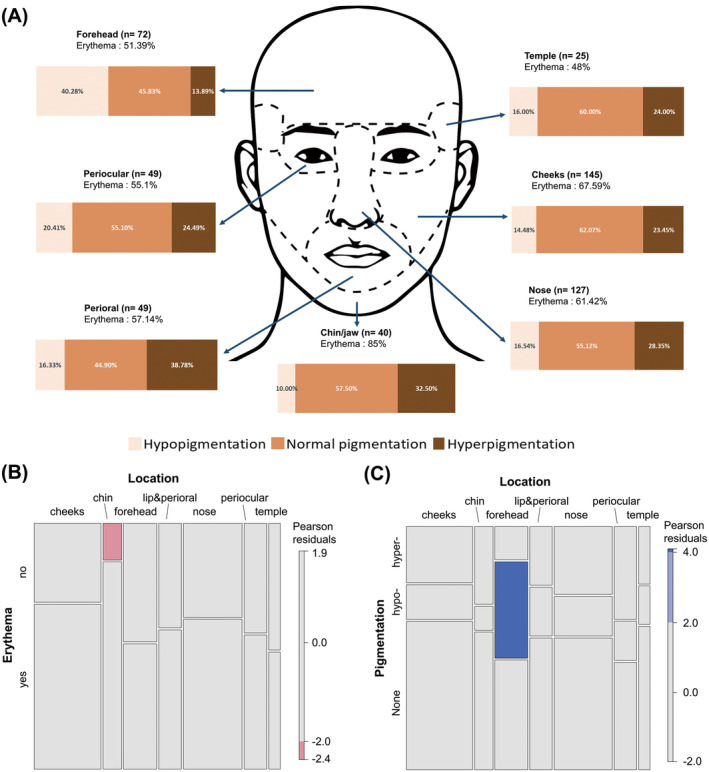
(A) Proportion of scars with colour changes according to the location. (B) Mosaic plot comparing the occurrence of erythema across locations. (C) Mosaic plot comparing the occurrence of hypo‐ or hyperpigmentation across locations.
Official websites use .gov
A
.gov website belongs to an official
government organization in the United States.
Secure .gov websites use HTTPS
A lock (
) or https:// means you've safely
connected to the .gov website. Share sensitive
information only on official, secure websites.
(A) Proportion of scars with colour changes according to the location. (B) Mosaic plot comparing the occurrence of erythema across locations. (C) Mosaic plot comparing the occurrence of hypo‐ or hyperpigmentation across locations.