
FIGURE 3.
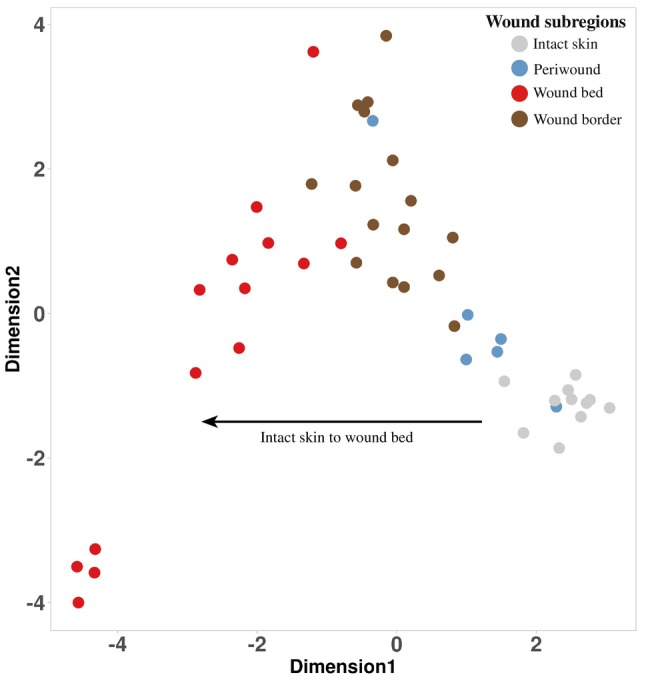
Multidimensional scaling plot to visualize wound subregions. A multidimensional scaling (MDS) plot presenting the first two dimensions displayed the data associated with wound subregions (aggregated across wound type) and intact skin. The MDS plot was generated based on averaging the gene expression values per patient, subregion to highlight a specific subregion trajectory. Each point represented the average gene expression for each sample (see legend at top right).