FIGURE 7.

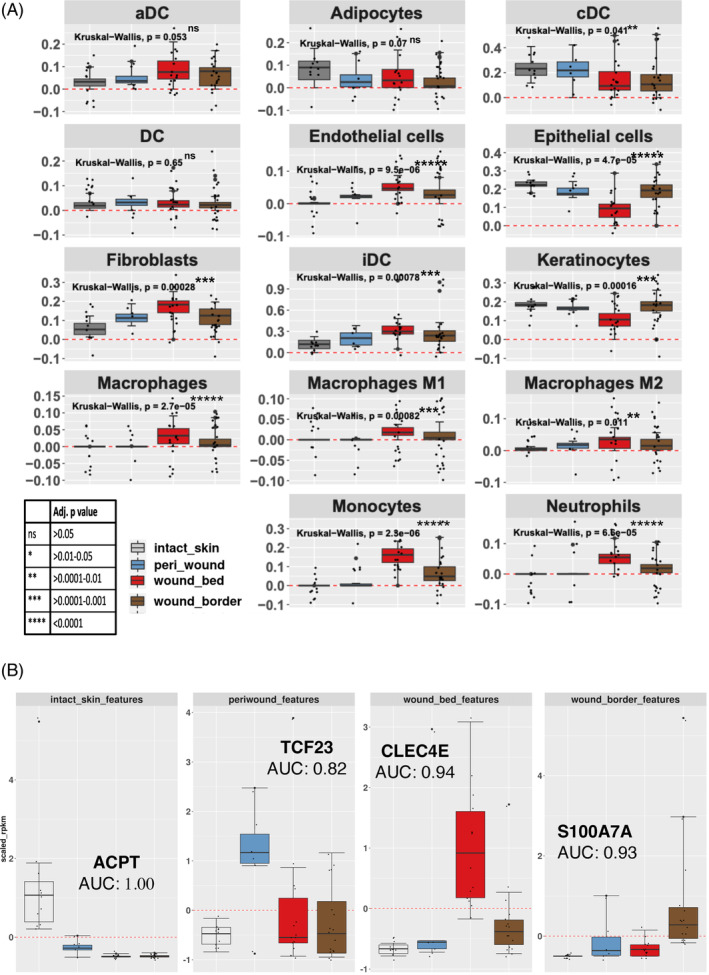
Logistic regression of cell type abundance to classify wound subregions. (A) Cell types involved in wound healing and shown in Supplementary Table 7 were inferred utilizing the xCell R library. Each graph denotes the expression of the cohort of genes that represent the cell type shown in the header. Each bar represents the scaled average expression (RPKM) for each subregion (see legend, bottom left). Each dot represents the average expression of a given gene (RPKM) that contributes to the identification of the cell type. (B) Elastic Net logistic regression analysis was used to identify candidate classification markers for specifically discriminating wound subregions and assessing using the AUC values as shown. The genes shown were selected from the subset identified by this method (using the shrinkage term within ElasticNet methods), as examples to explore their discriminatory power. Each bar represents the scaled median expression value for specific gene expression markers for each subregion identified (legend in A). Identified candidate marker genes differentiated between the various subregions. ACPT is a marker gene that was decreased in all three wound subregions compared to intact skin (AUC = 1.00). DC, dendritic cells; aDC, activated dendritic cells; cDC, conventional/classical dendritic cells; iDC, interstitial dendritic cells.
