
FIGURE 8.
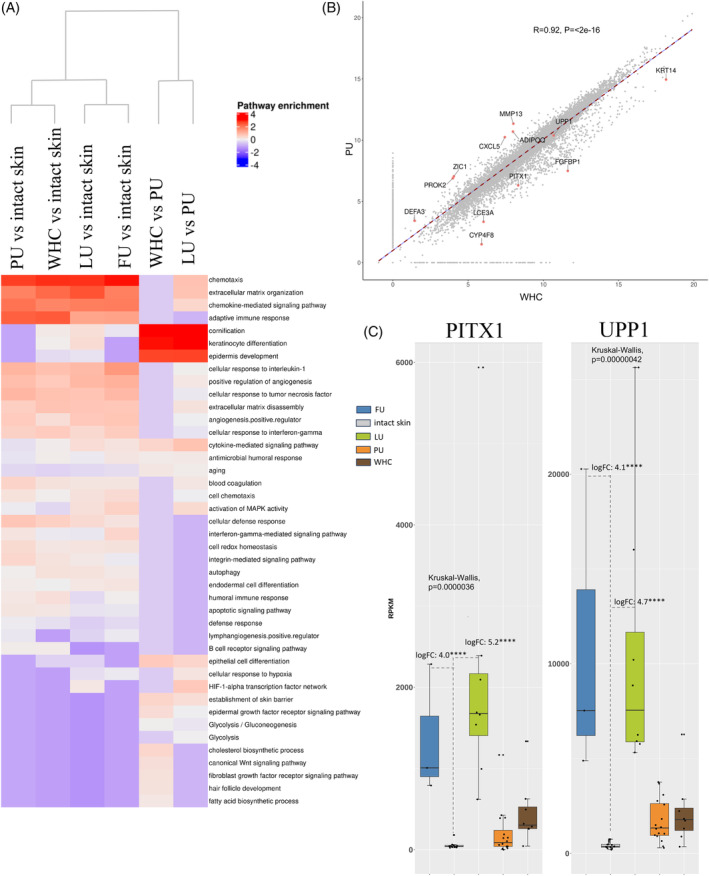
Molecular comparisons across different wound types. (A) Heatmap clustering of enriched regulated pathways detected for each wound type versus intact skin. The following comparisons are shown, PU, LU, FU and WHC versus intact skin, each, WHC versus PU and LU versus PU. Biosystem, Interpro, and Gene Ontology sets were used for gene set enrichment analysis (GSEA). Upregulated genes identified in pairwise comparisons were included in this analysis. The rows correspond to enriched pathways and columns correspond to comparisons between ulcer types. The column dendrogram was generated using the Euclidean distance metric based on the enrichment results for each comparison. The scaled, log10 transformed, enrichment results are colour‐coded (blue, downregulated enriched; white, not regulated; red, upregulated enriched; see legend, top right). The heatmap highlights the difference in enrichment results based on comparisons between ulcer types. (B) Scatter plot illustrating the correlations linking PUs and WHCs using global gene expression values (i.e., scaled RPKMs) with a Pearson correlation of 0.92 (p‐value, <2e−16) indicating a high degree of similarity. Genes highlighted here are those representing the most prominent differences between the two ulcer types. (C) Increased expression of PITX1 and UPP1 in LUs and FUs. Bar graphs illustrating the average expression (RPKM) of PITX1 and UPP1, across the various ulcer types. The bars are colour‐coded by ulcer type (legend top). Each dot represents the average gene expression for one donor. Error bars represent the standard deviation of gene expression across all donors. Expression levels of both PITX1 and UPP1 were elevated in LUs and FUs compared to other wound types and intact skin.