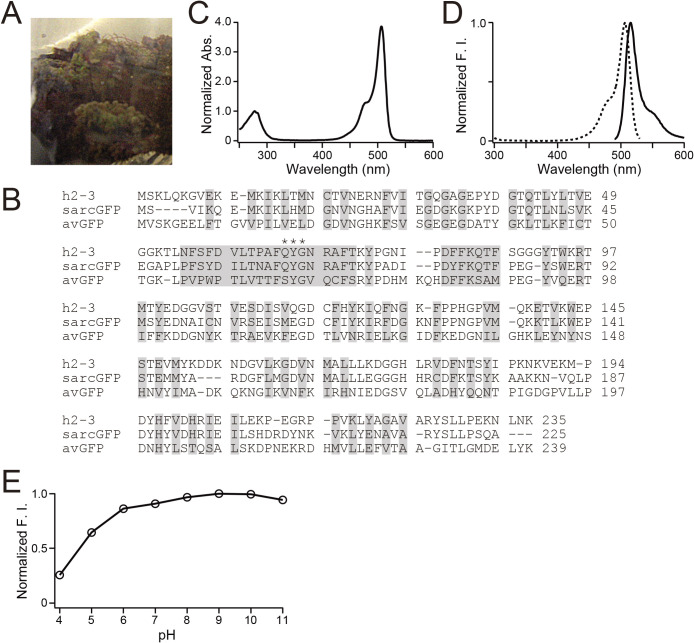
Fig. 4.
Molecular and spectroscopic characterizations of h2-3
(A) Ricordea sp.
(B) Amino acid sequence (single-letter code) alignments of h2-3, sarcGFP, and Aequorea victoria GFP (avGFP). Residues whose side chains form the interior of the β-barrel are shaded. Residues responsible for chromophore synthesis are indicated by asterisks.
(C) Absorption spectrum of h2-3. The spectrum is normalized by the peak at 280 nm.
(D) Normalized excitation (dotted line) and emission (solid line) spectra of h2-3. F.I., fluorescence intensity.
(E) pH dependence of the fluorescence of h2-3. F.I., fluorescence intensity.

