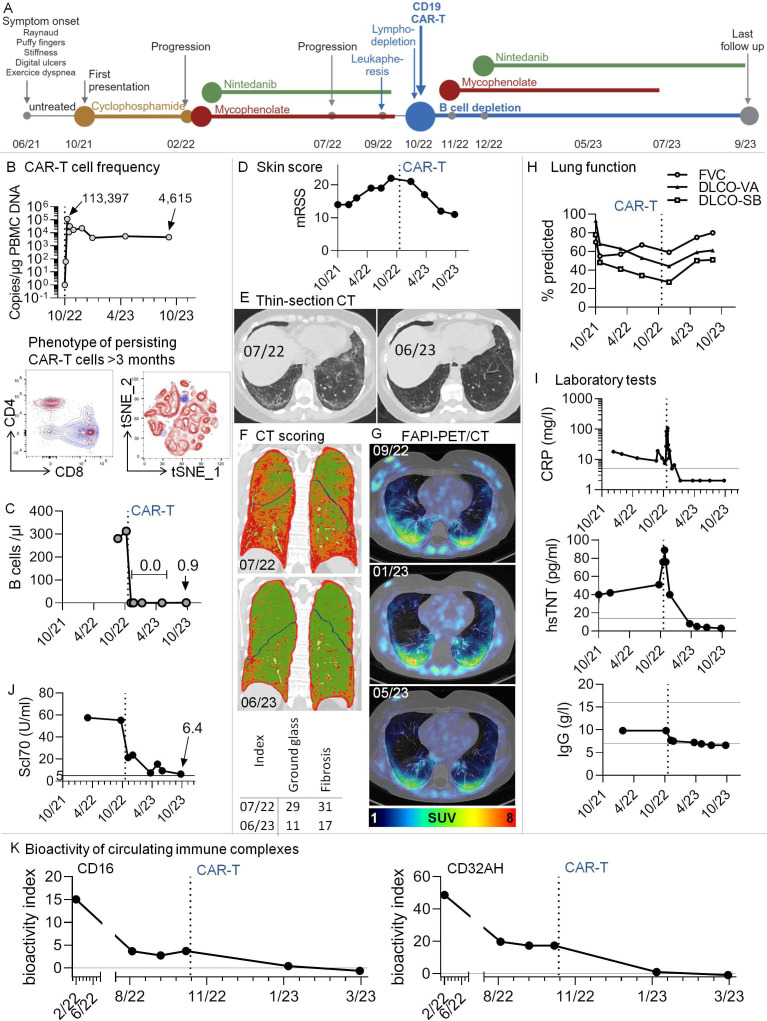
Figure 1.
Multimodal therapy including third-generation CD19.CAR-T-cells in a patient with Scl70+systemic sclerosis and progressive pulmonary fibrosis. (A) Graphical overview of disease course and therapeutic regimen. (B) Top: CAR-T-cells rapidly expanded in vivo and were still detectable after 11 months. The graph shows copy numbers of the CAR construct related to the amount of DNA in peripheral blood mononuclear cells (PBMCs), as determined by PCR. Bottom: High-dimensional spectral flow cytometry was used to phenotype persisting CAR-T-cells at months 3 and 7 after infusion. An antibody against the CD19-CAR construct was used to identify CAR-T-cells. Data from the two time points were in silico concatenated and shown together in single graphs. The dot plots show overlays of persisting CAR-T-cells (blue) with non-CAR total (left) and CD8+ (right) T cells after gating on non-doublet, viable, CD45+CD3+ lymphocytes. (C) B-cell counts were determined by standard conventional flow cytometry. No B-cells could be detected after CAR-T therapy. In 10/23, very low levels of B-cells were redetectable (0.9 /µL). (D) Modified Rodnan Skin Score (mRSS). The degree of skin sclerosis was evaluated by the same treating rheumatologist over time. (E) Thin-section CT. Ground glass opacification and signs of pulmonary fibrosis decreased dramatically after CAR-T-cell therapy. Example axial non-enhanced images before/after CAR-T-cell therapy; (F) CT scoring. Colour-coded coronal images at the indicated time points before/after CAR-T therapy. Based on radiological densities in CT scans (Hounsfield units), cut-off values were chosen to separate lung areas into ‘normal’, ‘ground glass’ and‘fibrosis’ using an algorithm, similar to previously described.6 These areas were imaged by a colour-code (green: normal lung, orange: ground glass, red: fibrosis). Bottom: For volumetric quantification, summarising ground glass and fibrosis indices were calculated, with indices giving the relative volume of affected lung parenchyma. (G) Low-dose CT scans were combined with fibroblast activation protein-inhibitor positron emission tomography (68Ga-FAPI-PET/CT), an imaging modality to assess fibroblast activation in vivo. Pulmonary areas with 68Ga-FAPI-uptake showed a tendency for regression. SUV, standardised uptake value; HU, Hounsfield units. (H) Lung function tests were performed at several time points before and after CAR-T-cell infusion. (I) Selected clinical laboratory test results over time. Additional horizontal lines denote normal ranges. (J) Anti-Scl70 (topoisomerase) autoantibodies over time. The horizontal line denotes the cut-off of normal. (K) Longitudinal measurement of the bioactivity of circulating immune complexes at Fcɣ-receptor-IIIA and -IIA (CD16 and CD32AH) indicating the disappearance of bioactive immune complexes after CAR-T-cell therapy. A functional reporter cell-based assay was applied as reported earlier.16 The bioactivity index was calculated by (mean sample−mean negative control)/(mean positive control−mean negative control)×100, leading to results between 0 and 100. The bioactivity index is both a surrogate of the presence of soluble immune complexes in serum and proof of their bioactivity via Fcɣ-receptor engagement. DLCO-SB/-VA, single-breath/ventilation-adapted diffusion capacities; FVC, forced vital capacity; CRP, C reactive protein; hsTNT, highly sensitive troponin T.

