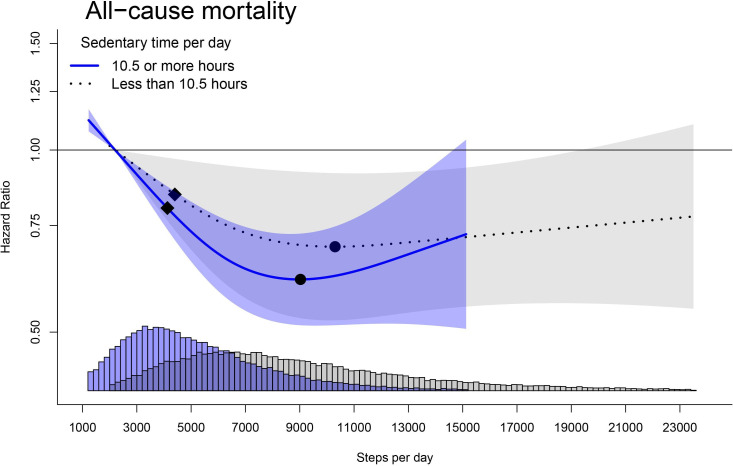
Figure 3.
Stratified dose–response association of all-cause mortality and steps by sedentary time. Adjusted for age, sex, ethnicity, education, smoking status, alcohol consumption, diet, parental history of CVD and cancer, medication use (cholesterol, insulin and hypertension) and sleep duration. Shaded area represents 95% CI. Square=minimum dose (ED50); circle=optimum dose (nadir of curve). CVD, cardiovascular disease.

